|
See also:
|
| . |
. |
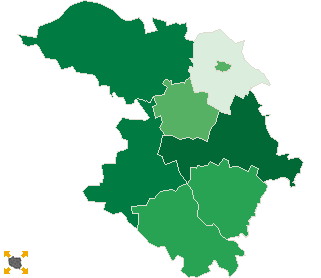
Number of people entitled to vote, number of ballot papers issued |
. |
. |
| . |
. |
| . |
. |
. |
. |
. |
. |
. |
. |
. |
. |
. |
. |
| No. |
Name |
No. of polling |
No. of people
entitled to vote |
No. of
ballot papers
issued |
No. of ballot papers issued / No. of people entitled to vote [%] |
| wards |
wards which
transmitted the results |
| 302402 | Duszniki, gm. | 4 | 4 | 6377 | 2142 | 33.59 |  |
| 302403 | Kaźmierz, gm. | 5 | 5 | 5536 | 1902 | 34.36 | |
| 302404 | Obrzycko, gm. | 2 | 2 | 3305 | 890 | 26.93 | |
| 302401 | Obrzycko, m. | 1 | 1 | 1787 | 579 | 32.40 | |
| 302405 | Ostroróg, gm. | 2 | 2 | 3794 | 1245 | 32.81 | |
| 302406 | Pniewy, gm. | 7 | 7 | 9402 | 3412 | 36.29 | |
| 302407 | Szamotuły, gm. | 17 | 17 | 22721 | 8563 | 37.69 | |
| 302408 | Wronki, gm. | 14 | 14 | 16543 | 5988 | 36.20 | |
| |
szamotulski, pow. |
52 |
52 |
69465 |
24721 |
35.59 |
 |
|
| |
| . |
. |
Turnout by location of ward electoral commission |
. |
. |
| . |
. |
| . |
. |
. |
. |
. |
. |
. |
. |
. |
. |
. |
. |
| No. |
Name |
No. of polling |
No. of people
entitled to vote |
No. of
ballot papers
issued |
No. of ballot papers issued / No. of people entitled to vote [%] |
| wards |
wards which
transmitted the results |
| 1 | rural commune | 11 | 11 | 15218 | 4934 | 32.42 | |
| 2 | urban - rural commune | 40 | 40 | 52460 | 19208 | 36.61 | |
| 3 | urban commune | 1 | 1 | 1787 | 579 | 32.40 | |
|
|


 Legal Acts

 Legal Acts