|
See also:
|
| . |
. |
Number of people entitled to vote, number of ballot papers issued |
. |
. |
| . |
. |
| . |
. |
. |
. |
. |
. |
. |
. |
. |
. |
. |
. |
| No. |
Name |
No. of polling |
No. of people
entitled to vote |
No. of
ballot papers
issued |
No. of ballot papers issued / No. of people entitled to vote [%] |
| wards |
wards which
transmitted the results |
| 241603 | Irządze, gm. | 3 | 3 | 2329 | 534 | 22.93 |  |
| 241604 | Kroczyce, gm. | 5 | 5 | 4957 | 1563 | 31.53 | |
| 241605 | Łazy, gm. | 10 | 10 | 13376 | 5139 | 38.42 | |
| 241606 | Ogrodzieniec, gm. | 6 | 6 | 7933 | 2657 | 33.49 | |
| 241607 | Pilica, gm. | 7 | 7 | 7502 | 2562 | 34.15 | |
| 241601 | Poręba, m. | 5 | 5 | 7363 | 2405 | 32.66 | |
| 241608 | Szczekociny, gm. | 9 | 9 | 6973 | 2399 | 34.40 | |
| 241609 | Włodowice, gm. | 4 | 4 | 4324 | 1245 | 28.79 | |
| 241602 | Zawiercie, m. | 34 | 34 | 44804 | 15749 | 35.15 | |
| 241610 | Żarnowiec, gm. | 7 | 7 | 3912 | 1304 | 33.33 | |
| |
zawierciański, pow. |
90 |
90 |
103473 |
35557 |
34.36 |
 |
|
| |
| . |
. |
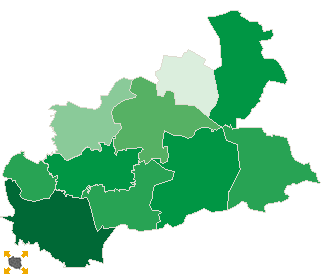
Turnout by location of ward electoral commission |
. |
. |
| . |
. |
| . |
. |
. |
. |
. |
. |
. |
. |
. |
. |
. |
. |
| No. |
Name |
No. of polling |
No. of people
entitled to vote |
No. of
ballot papers
issued |
No. of ballot papers issued / No. of people entitled to vote [%] |
| wards |
wards which
transmitted the results |
| 1 | rural commune | 19 | 19 | 15522 | 4646 | 29.93 | |
| 2 | urban - rural commune | 32 | 32 | 35784 | 12757 | 35.65 | |
| 3 | urban commune | 39 | 39 | 52167 | 18154 | 34.80 | |
|
|


 Legal Acts

 Legal Acts