|
See also:
|
| . |
. |
Number of people entitled to vote, number of ballot papers issued |
. |
. |
| . |
. |
| . |
. |
. |
. |
. |
. |
. |
. |
. |
. |
. |
. |
| No. |
Name |
No. of polling |
No. of people
entitled to vote |
No. of
ballot papers
issued |
No. of ballot papers issued / No. of people entitled to vote [%] |
| wards |
wards which
transmitted the results |
| 241505 | Godów, gm. | 8 | 8 | 10064 | 4301 | 42.74 |  |
| 241506 | Gorzyce, gm. | 14 | 14 | 15726 | 6131 | 38.99 | |
| 241507 | Lubomia, gm. | 8 | 8 | 6472 | 1962 | 30.32 | |
| 241508 | Marklowice, gm. | 3 | 3 | 4150 | 1738 | 41.88 | |
| 241509 | Mszana, gm. | 4 | 4 | 5475 | 2143 | 39.14 | |
| 241501 | Pszów, m. | 5 | 5 | 11491 | 4255 | 37.03 | |
| 241502 | Radlin, m. | 8 | 8 | 14217 | 5377 | 37.82 | |
| 241503 | Rydułtowy, m. | 14 | 14 | 17753 | 6241 | 35.15 | |
| 241504 | Wodzisław Śląski, m. | 29 | 29 | 39450 | 15340 | 38.88 | |
| |
wodzisławski, pow. |
93 |
93 |
124798 |
47488 |
38.05 |
 |
|
| |
| . |
. |
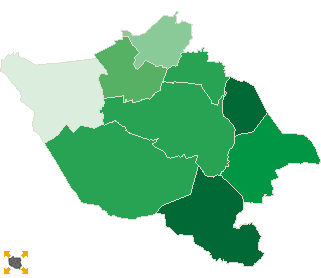
Turnout by location of ward electoral commission |
. |
. |
| . |
. |
| . |
. |
. |
. |
. |
. |
. |
. |
. |
. |
. |
. |
| No. |
Name |
No. of polling |
No. of people
entitled to vote |
No. of
ballot papers
issued |
No. of ballot papers issued / No. of people entitled to vote [%] |
| wards |
wards which
transmitted the results |
| 1 | rural commune | 37 | 37 | 41887 | 16275 | 38.85 | |
| 2 | urban commune | 56 | 56 | 82911 | 31213 | 37.65 | |
|
|


 Legal Acts

 Legal Acts