|
See also:
|
| . |
. |
Number of people entitled to vote, number of ballot papers issued |
. |
. |
| . |
. |
| . |
. |
. |
. |
. |
. |
. |
. |
. |
. |
. |
. |
| No. |
Name |
No. of polling |
No. of people
entitled to vote |
No. of
ballot papers
issued |
No. of ballot papers issued / No. of people entitled to vote [%] |
| wards |
wards which
transmitted the results |
| 160901 | Chrząstowice, gm. | 5 | 5 | 5301 | 1515 | 28.58 |  |
| 160902 | Dąbrowa, gm. | 8 | 8 | 7500 | 2490 | 33.20 | |
| 160903 | Dobrzeń Wielki, gm. | 13 | 13 | 11253 | 3317 | 29.48 | |
| 160904 | Komprachcice, gm. | 6 | 6 | 8773 | 2763 | 31.49 | |
| 160905 | Łubniany, gm. | 4 | 4 | 7475 | 2105 | 28.16 | |
| 160906 | Murów, gm. | 5 | 5 | 4675 | 1205 | 25.78 | |
| 160907 | Niemodlin, gm. | 11 | 11 | 10784 | 3285 | 30.46 | |
| 160908 | Ozimek, gm. | 16 | 16 | 17137 | 4815 | 28.10 | |
| 160909 | Popielów, gm. | 5 | 5 | 6770 | 1907 | 28.17 | |
| 160910 | Prószków, gm. | 9 | 9 | 7805 | 2569 | 32.91 | |
| 160911 | Tarnów Opolski, gm. | 8 | 8 | 7782 | 2044 | 26.27 | |
| 160912 | Tułowice, gm. | 4 | 4 | 4331 | 1376 | 31.77 | |
| 160913 | Turawa, gm. | 8 | 8 | 7765 | 2109 | 27.16 | |
| |
opolski, pow. |
102 |
102 |
107351 |
31500 |
29.34 |
 |
|
| |
| . |
. |
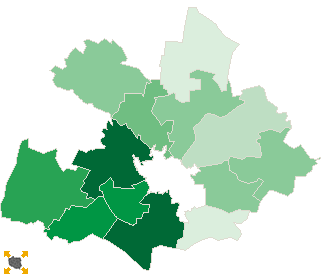
Turnout by location of ward electoral commission |
. |
. |
| . |
. |
| . |
. |
. |
. |
. |
. |
. |
. |
. |
. |
. |
. |
| No. |
Name |
No. of polling |
No. of people
entitled to vote |
No. of
ballot papers
issued |
No. of ballot papers issued / No. of people entitled to vote [%] |
| wards |
wards which
transmitted the results |
| 1 | rural commune | 66 | 66 | 71625 | 20831 | 29.08 | |
| 2 | urban - rural commune | 36 | 36 | 35726 | 10669 | 29.86 | |
|
|


 Legal Acts

 Legal Acts