|
See also:
|
| . |
. |
Number of people entitled to vote, number of ballot papers issued |
. |
. |
| . |
. |
| . |
. |
. |
. |
. |
. |
. |
. |
. |
. |
. |
. |
| No. |
Name |
No. of polling |
No. of people
entitled to vote |
No. of
ballot papers
issued |
No. of ballot papers issued / No. of people entitled to vote [%] |
| wards |
wards which
transmitted the results |
| 120502 | Biecz, gm. | 13 | 13 | 13370 | 4690 | 35.08 |  |
| 120503 | Bobowa, gm. | 7 | 7 | 6756 | 2699 | 39.95 | |
| 120504 | Gorlice, gm. | 11 | 11 | 12724 | 4873 | 38.30 | |
| 120501 | Gorlice, m. | 22 | 22 | 24194 | 9599 | 39.68 | |
| 120505 | Lipinki, gm. | 7 | 7 | 5373 | 1996 | 37.15 | |
| 120506 | Łużna, gm. | 7 | 7 | 6268 | 2373 | 37.86 | |
| 120507 | Moszczenica, gm. | 3 | 3 | 3669 | 1179 | 32.13 | |
| 120508 | Ropa, gm. | 4 | 4 | 3750 | 1643 | 43.81 | |
| 120509 | Sękowa, gm. | 6 | 6 | 3748 | 1351 | 36.05 | |
| 120510 | Uście Gorlickie, gm. | 10 | 10 | 4916 | 1763 | 35.86 | |
| |
gorlicki, pow. |
90 |
90 |
84768 |
32166 |
37.95 |
 |
|
| |
| . |
. |
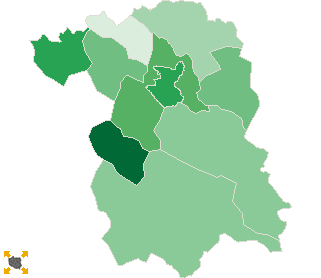
Turnout by location of ward electoral commission |
. |
. |
| . |
. |
| . |
. |
. |
. |
. |
. |
. |
. |
. |
. |
. |
. |
| No. |
Name |
No. of polling |
No. of people
entitled to vote |
No. of
ballot papers
issued |
No. of ballot papers issued / No. of people entitled to vote [%] |
| wards |
wards which
transmitted the results |
| 1 | rural commune | 55 | 55 | 47204 | 17877 | 37.87 | |
| 2 | urban - rural commune | 13 | 13 | 13370 | 4690 | 35.08 | |
| 3 | urban commune | 22 | 22 | 24194 | 9599 | 39.68 | |
|
|


 Legal Acts

 Legal Acts