.
.
Legal Acts
Documents
Electoral Bodies
Election Committees and Candidates
Turnout
Results
Statistical Data
SEJM
Created by
.
.
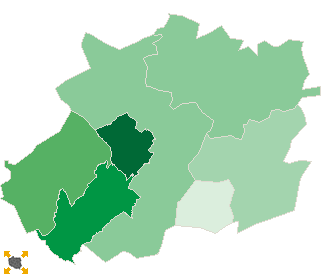
Turnout
.
.
.
Number of People who has voted until 16:30
.
.
.
.
.
.
.
.
.
.
.
.
.
.
.
.
.
.
.
.
Polska
/
Wałbrzych
/
dzierżoniowski, pow.
Statistics on 19.10.2007
Population:
106975
Area:
478.72 km2
Population density:
223 os/km2
Election Statistic
No. of polling wards:
71
No. of polling wards which
transmitted the results:
71
No. of people entitled to vote:
88076
No. of ballot papers issued:
30403
34.52%
lack
26.86%
27.99%
29.12%
30.25%
31.38%
32.51%
33.64%
34.77%
35.90%
37.03%
of data
27.98%
29.11%
30.24%
31.37%
32.50%
33.63%
34.76%
35.89%
37.02%
38.16%
See also:
Turnout in Election to The Sejm
Turnout by location of ward electoral commission
.
.
Number
of people entitled to vote, number of ballot papers issued
.
.
.
.
.
.
.
.
.
.
.
.
.
.
.
.
No.
Name
No. of polling
No. of people
entitled to vote
No. of
ballot papers
issued
No. of ballot papers issued / No. of people entitled to vote [%]
wards
wards which
transmitted the results
020201
Bielawa, m.
15
15
26523
9374
35.34
020205
Dzierżoniów, gm.
13
13
7749
2372
30.61
020202
Dzierżoniów, m.
20
20
29644
11306
38.14
020206
Łagiewniki, gm.
6
6
6057
1858
30.68
020207
Niemcza, gm.
6
6
4944
1490
30.14
020203
Pieszyce, m.
8
8
7827
2571
32.85
020204
Piława Górna, m.
3
3
5332
1432
26.86
dzierżoniowski, pow.
71
71
88076
30403
34.52
.
.
Turnout by location of ward electoral commission
.
.
.
.
.
.
.
.
.
.
.
.
.
.
.
.
No.
Name
No. of polling
No. of people
entitled to vote
No. of
ballot papers
issued
No. of ballot papers issued / No. of people entitled to vote [%]
wards
wards which
transmitted the results
1
rural commune
19
19
13806
4230
30.64
2
urban - rural commune
6
6
4944
1490
30.14
3
urban commune
46
46
69326
24683
35.60
Legal Acts
Documents
Electoral Bodies
Election Committees and Candidates
Turnout
Results
Statistical Data
SEJM
Created by
Copyright © 2007
Mikrobit Sp. z o.o.
. All Rights Reserved.
top