|
See also:
|
| . |
. |
Number of people entitled to vote, number of ballot papers issued |
. |
. |
| . |
. |
| . |
. |
. |
. |
. |
. |
. |
. |
. |
. |
. |
. |
| No. |
Name |
No. of polling |
No. of people
entitled to vote |
No. of
ballot papers
issued |
No. of ballot papers issued / No. of people entitled to vote [%] |
| wards |
wards which
transmitted the results |
| 060500 | janowski, pow. | 37 | 37 | 38394 | 3537 | 9.21 |  |
| 060700 | kraśnicki, pow. | 84 | 84 | 80531 | 6696 | 8.31 | |
| 060800 | lubartowski, pow. | 86 | 86 | 72122 | 5512 | 7.64 | |
| 060900 | lubelski, pow. | 118 | 118 | 109767 | 8577 | 7.81 | |
| 066301 | Lublin, m. | 204 | 204 | 274601 | 24405 | 8.89 | |
| 061000 | łęczyński, pow. | 47 | 47 | 44239 | 3047 | 6.89 | |
| 061100 | łukowski, pow. | 87 | 87 | 84687 | 5835 | 6.89 | |
| 061200 | opolski, pow. | 60 | 60 | 51156 | 3447 | 6.74 | |
| 061400 | puławski, pow. | 88 | 88 | 95299 | 8446 | 8.86 | |
| 061600 | rycki, pow. | 64 | 64 | 47926 | 3351 | 6.99 | |
| 061700 | świdnicki, pow. | 53 | 53 | 58793 | 3930 | 6.68 | |
| |
Lublin, okr. 6 |
928 |
928 |
957515 |
76783 |
8.02 |
 |
|
| |
| . |
. |
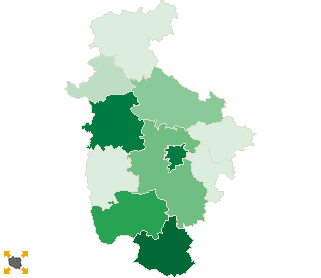
Turnout by location of ward electoral commission |
. |
. |
| . |
. |
| . |
. |
. |
. |
. |
. |
. |
. |
. |
. |
. |
. |
| No. |
Name |
No. of polling |
No. of people
entitled to vote |
No. of
ballot papers
issued |
No. of ballot papers issued / No. of people entitled to vote [%] |
| wards |
wards which
transmitted the results |
| 1 | rural commune | 463 | 463 | 382564 | 28253 | 7.39 | |
| 2 | urban - rural commune | 148 | 148 | 136144 | 10700 | 7.86 | |
| 3 | urban commune | 113 | 113 | 164206 | 13425 | 8.18 | |
| 4 | town with district rights | 204 | 204 | 274601 | 24405 | 8.89 | |
|
|


 Legal Acts

 Legal Acts