.
.
Legal Acts
Documents
Electoral Bodies
Election Committees and Candidates
Turnout
Results
Statistical Data
SEJM
Created by
.
.
Turnout
.
.
.
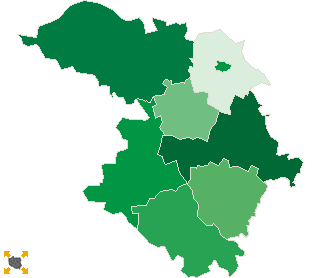
Turnout in Election to The Senate
.
.
.
.
.
.
.
.
.
.
.
.
.
.
.
.
.
.
.
.
Polska
/
Piła
/
szamotulski, pow.
...
szamotulski, pow.
Statistics on 19.10.2007
Population:
85997
Area:
1119.55 km2
Population density:
76 os/km2
Summary voting results
No. of polling wards:
52
No. of polling wards which
transmitted the results:
52
No. of people entitled to vote:
69541
No. of ballot papers issued:
36065
51.86%
lack
37.82%
39.60%
41.38%
43.16%
44.94%
46.72%
48.50%
50.28%
52.06%
53.84%
of data
39.59%
41.37%
43.15%
44.93%
46.71%
48.49%
50.27%
52.05%
53.83%
55.62%
See also:
Votes per Candidates
Turnout in Election to The Sejm
Turnout by location of ward electoral commission
.
.
Voting results
.
.
.
.
.
.
.
.
.
.
.
.
.
.
.
.
No.
Name
No. entitled
to vote
No. of ballot
papers issued
No. of
No. of ballot papers issued / No. entitled to vote
[%]
total votes
valid votes
302402
Duszniki, gm.
6379
3195
3193
3061
50.09
302403
Kaźmierz, gm.
5541
2683
2653
2608
48.42
302404
Obrzycko, gm.
3307
1251
1249
1208
37.83
302401
Obrzycko, m.
1789
904
904
877
50.53
302405
Ostroróg, gm.
3794
1713
1710
1646
45.15
302406
Pniewy, gm.
9423
4800
4793
4616
50.94
302407
Szamotuły, gm.
22766
12658
12634
12324
55.60
302408
Wronki, gm.
16542
8861
8860
8586
53.57
szamotulski, pow.
69541
36065
35996
34926
51.86
.
.
Turnout by location of ward electoral commission
.
.
.
.
.
.
.
.
.
.
.
.
.
.
.
.
No.
Name
No. entitled
to vote
No. of ballot
papers issued
No. of
No. of ballot papers issued / No. entitled to vote
[%]
total votes
valid votes
1
City
36735
21027
20995
20430
57.24
2
Country
32806
15038
15001
14496
45.84
.
Turnout by number of inhabitants of commune
1
to 5 000
8890
3868
3863
3731
43.51
2
from 5 001 to 10 000
11920
5878
5846
5669
49.31
3
from 10 001 to 20 000
25965
13661
13653
13202
52.61
4
from 20 001 to 50 000
22766
12658
12634
12324
55.60
5
from 50 001 to 100 000
0
0
0
0
0.00
6
from 100 001 to 200 000
0
0
0
0
0.00
7
from 200 001 to 500 000
0
0
0
0
0.00
8
over 500 000
0
0
0
0
0.00
Legal Acts
Documents
Electoral Bodies
Election Committees and Candidates
Turnout
Results
Statistical Data
SEJM
Created by
Copyright © 2007
Mikrobit Sp. z o.o.
. All Rights Reserved.
top