|
See also:
|
| . |
. |
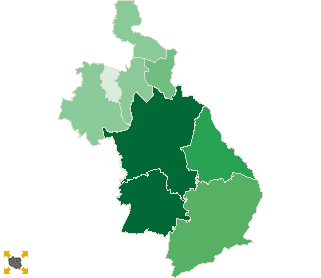
Voting results |
. |
. |
| . |
. |
| . |
. |
. |
. |
. |
. |
. |
. |
. |
. |
. |
. |
| No. |
Name |
No. entitled
to vote |
No. of ballot
papers issued |
No. of |
No. of ballot papers issued / No. entitled to vote
[%] |
| total votes |
valid votes |
| 241400 | bieruńsko-lędziński, pow. | 44235 | 24634 | 24621 | 24329 | 55.69 |  |
| 246301 | Chorzów, m. | 91436 | 49308 | 49291 | 48773 | 53.93 | |
| 246901 | Katowice, m. | 257450 | 159853 | 159652 | 158116 | 62.09 | |
| 247001 | Mysłowice, m. | 60796 | 34570 | 34549 | 34088 | 56.86 | |
| 247101 | Piekary Śląskie, m. | 48231 | 25798 | 25783 | 25278 | 53.49 | |
| 247201 | Ruda Śląska, m. | 115751 | 62073 | 62013 | 61058 | 53.63 | |
| 247401 | Siemianowice Śląskie, m. | 58608 | 32188 | 32175 | 31778 | 54.92 | |
| 247601 | Świętochłowice, m. | 43905 | 21443 | 21423 | 21176 | 48.84 | |
| 247701 | Tychy, m. | 105880 | 64827 | 64795 | 64096 | 61.23 | |
| |
Katowice, okr. 30 |
826292 |
474694 |
474302 |
468692 |
57.45 |
 |
|
| |
| . |
. |
Turnout by location of ward electoral commission |
. |
. |
| . |
. |
| . |
. |
. |
. |
. |
. |
. |
. |
. |
. |
. |
. |
| No. |
Name |
No. entitled
to vote |
No. of ballot
papers issued |
No. of |
No. of ballot papers issued / No. entitled to vote
[%] |
| total votes |
valid votes |
| 1 | City | 816542 | 468943 | 468551 | 463009 | 57.43 | |
| 2 | Country | 9750 | 5751 | 5751 | 5683 | 58.98 | |
| . |
Turnout by number of inhabitants of commune |
|
| 1 | to 5 000 | 0 | 0 | 0 | 0 | 0.00 | |
| 2 | from 5 001 to 10 000 | 16038 | 9435 | 9432 | 9316 | 58.83 | |
| 3 | from 10 001 to 20 000 | 28197 | 15199 | 15189 | 15013 | 53.90 | |
| 4 | from 20 001 to 50 000 | 0 | 0 | 0 | 0 | 0.00 | |
| 5 | from 50 001 to 100 000 | 211540 | 113999 | 113930 | 112320 | 53.89 | |
| 6 | from 100 001 to 200 000 | 313067 | 176208 | 176099 | 173927 | 56.28 | |
| 7 | from 200 001 to 500 000 | 257450 | 159853 | 159652 | 158116 | 62.09 | |
| 8 | over 500 000 | 0 | 0 | 0 | 0 | 0.00 | |
|
|


 Legal Acts

 Legal Acts