.
.
Legal Acts
Documents
Electoral Bodies
Election Committees and Candidates
Turnout
Results
Statistical Data
SENATE
Created by
.
.
Voting Results
.
.
.
Voting Results for Committee
.
.
.
.
.
.
.
.
.
.
.
.
.
.
.
.
.
.
.
.
Polska
/
Szczecin
/
pyrzycki, pow.
...
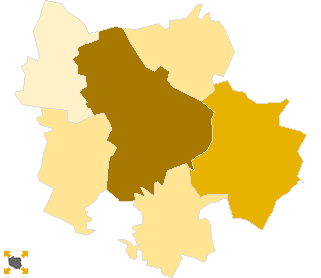
Koalicyjny Komitet Wyborczy Lewica i Demokraci SLD+SDPL+PD+UP
List's Number:
20
No. of valid votes:
13630
No. of votes per List:
2220
16.29%
lack
10.66%
11.47%
12.28%
13.09%
13.90%
14.71%
15.52%
16.33%
17.14%
17.95%
not
of data
11.46%
12.27%
13.08%
13.89%
14.70%
15.51%
16.32%
17.13%
17.94%
18.76%
applicable
See also:
Turnout
Votes per Lists
Votes per Candidates
Information about Election Committee
Election results
Voting Results by location of ward electoral commission
.
.
Voting Results for Committee.
.
.
.
.
.
.
.
.
.
.
.
.
.
.
.
.
.
No.
Name
No. of entitled
to vote
No. of ballot papers
issued
No. of votes
No. of votes: per list / valid [%]
total
valid
per List
321201
Bielice, gm.
2312
918
918
872
93
10.67
321202
Kozielice, gm.
2086
798
798
764
99
12.96
321203
Lipiany, gm.
5011
2065
2060
1988
259
13.03
321204
Przelewice, gm.
4264
1589
1589
1522
254
16.69
321205
Pyrzyce, gm.
15779
7641
7639
7395
1381
18.67
321206
Warnice, gm.
2718
1127
1127
1089
134
12.30
pyrzycki, pow.
32170
14138
14131
13630
2220
16.29
.
.
Voting Results for Candidates
.
.
.
.
.
.
.
.
.
.
.
.
.
.
.
No.
Surname Names
No. of votes
% No. of votes per candidate/No. per list
% No. of votes per candidate/No. of valid votes
1
NAPIERALSKI Grzegorz Bernard
803
36.17
5.89
2
POPIELA Radosław Paweł
31
1.39
0.23
3
ARŁUKOWICZ Bartosz Adam
534
24.05
3.92
4
WIJAS Jędrzej Piotr
30
1.35
0.22
5
MAZUR Dorota Aldona
64
2.88
0.47
6
AGATOWSKA Joanna Monika
25
1.12
0.18
7
KAWĘCKI Jaromir
19
0.85
0.14
8
ŚWIĘCICKI Ryszard Wacław
15
0.67
0.11
9
ROMERO Elżbieta Józefa
35
1.57
0.26
10
MICKIEWICZ Andrzej
31
1.39
0.23
11
BETYNA Robert
458
20.63
3.36
12
SOCHA Agata Maria
32
1.44
0.23
13
SYLWESTRZAK Jan Wacław
18
0.81
0.13
14
CIECIÓRSKI Leszek
6
0.27
0.04
15
AMBROZIAK Piotr Michał
6
0.27
0.04
16
SZCZERSKI Grzegorz Remigiusz
8
0.36
0.06
17
ROKICKI Dominik Krzysztof
5
0.22
0.04
18
DROZDOWICZ Radosław Daniel
3
0.13
0.02
19
JANICZEK Piotr Łukasz
2
0.09
0.01
20
GOZDOWSKI Krzysztof Robert
1
0.04
0.01
21
DOBRZYŃSKI Łukasz Michał
5
0.22
0.04
22
RYCIELSKI Radosław Marcin
1
0.04
0.01
23
ŻUK Anna Magdalena
65
2.92
0.48
24
BOT Paweł
8
0.36
0.06
25
JAGUŚ Tadeusz
6
0.27
0.04
26
GIZA Andrzej Tadeusz
9
0.40
0.07
Σ
2220
100.00
16.28
.
.
Voting Results by location of ward electoral commission.
.
.
.
.
.
.
.
.
.
.
.
.
.
.
.
.
.
No.
Name
No. of entitled
to vote
No. of ballot
papers issued
No. of votes
No. of votes: per list / valid [%]
total
valid
per List
1
City
14542
7343
7338
7126
1283
18.00
2
Country
17628
6795
6793
6504
937
14.41
.
Voting Results by number of inhabitants of commune
.
1
to 5 000
7116
2843
2843
2725
326
11.96
2
from 5 001 to 10 000
9275
3654
3649
3510
513
14.62
3
from 10 001 to 20 000
15779
7641
7639
7395
1381
18.67
4
from 20 001 to 50 000
0
0
0
0
0
0.00
5
from 50 001 to 100 000
0
0
0
0
0
0.00
6
from 100 001 to 200 000
0
0
0
0
0
0.00
7
from 200 001 to 500 000
0
0
0
0
0
0.00
8
over 500 000
0
0
0
0
0
0.00
Legal Acts
Documents
Electoral Bodies
Election Committees and Candidates
Turnout
Results
Statistical Data
SENATE
Created by
Copyright © 2007
Mikrobit Sp. z o.o.
. All Rights Reserved.
top