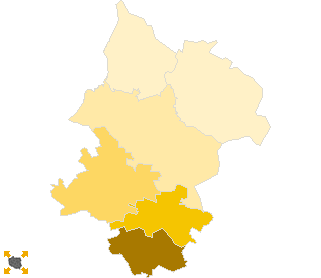
.
.
Legal Acts
Documents
Electoral Bodies
Election Committees and Candidates
Turnout
Results
Statistical Data
SENATE
Created by
.
.
Voting Results
.
.
.
Voting Results for Committee
.
.
.
.
.
.
.
.
.
.
.
.
.
.
.
.
.
.
.
.
Polska
/
Kielce
/
włoszczowski, pow.
...
Koalicyjny Komitet Wyborczy Lewica i Demokraci SLD+SDPL+PD+UP
List's Number:
20
No. of valid votes:
16686
No. of votes per List:
2284
13.69%
lack
5.37%
9.11%
12.85%
16.59%
20.33%
24.07%
27.81%
31.55%
35.29%
39.03%
not
of data
9.10%
12.84%
16.58%
20.32%
24.06%
27.80%
31.54%
35.28%
39.02%
42.77%
applicable
See also:
Turnout
Votes per Lists
Votes per Candidates
Information about Election Committee
Election results
Voting Results by location of ward electoral commission
.
.
Voting Results for Committee.
.
.
.
.
.
.
.
.
.
.
.
.
.
.
.
.
.
No.
Name
No. of entitled
to vote
No. of ballot papers
issued
No. of votes
No. of votes: per list / valid [%]
total
valid
per List
261301
Kluczewsko, gm.
4135
1842
1842
1768
95
5.37
261302
Krasocin, gm.
8417
3669
3667
3565
296
8.30
261303
Moskorzew, gm.
2435
1201
1201
1150
491
42.70
261304
Radków, gm.
2202
743
743
722
204
28.25
261305
Secemin, gm.
4176
1541
1541
1491
324
21.73
261306
Włoszczowa, gm.
16471
8244
8226
7990
874
10.94
włoszczowski, pow.
37836
17240
17220
16686
2284
13.69
.
.
Voting Results for Candidates
.
.
.
.
.
.
.
.
.
.
.
.
.
.
.
No.
Surname Names
No. of votes
% No. of votes per candidate/No. per list
% No. of votes per candidate/No. of valid votes
1
KOPYCIŃSKI Sławomir Piotr
174
7.61
1.04
2
DUBANIOWSKI Waldemar Jan
124
5.42
0.74
3
STĘPIEŃ Włodzimierz Tadeusz
82
3.59
0.49
4
MILCARZ Henryk Mieczysław
75
3.28
0.45
5
WINIARCZYK-KOSSAKOWSKA Małgorzata Dorota
41
1.79
0.25
6
SUCHAŃSKI Jerzy Zdzisław
86
3.76
0.52
7
SIEJKA Robert
32
1.40
0.19
8
KWIECIEŃ Sylwester Andrzej
20
0.87
0.12
9
KRZYSIEK Zbigniew Stanisław
1502
65.76
9.00
10
MARCZEWSKI Sławomir
13
0.56
0.08
11
ISKRA Andrzej
10
0.43
0.06
12
KAMIŃSKA Inga Lidia
22
0.96
0.13
13
MAJCHERCZAK Bogusława Zofia
9
0.39
0.05
14
GAJDA Jan
20
0.87
0.12
15
ŁUDZIK Krystian Kazimierz
2
0.08
0.01
16
KILIAŃSKI Ryszard Ludwik
3
0.13
0.02
17
RURARZ Tomasz
3
0.13
0.02
18
CHODAKOWSKI Piotr Krzysztof
2
0.08
0.01
19
RĘKAS Stanisław Piotr
1
0.04
0.01
20
MARKIEWICZ Bożena Wioletta
4
0.17
0.02
21
ZYGAN Marek Józef
3
0.13
0.02
22
ADAMSKI Krzysztof
5
0.21
0.03
23
GRZYBEK Paweł Stefan
8
0.35
0.05
24
OPAŁKA Zbigniew
4
0.17
0.02
25
WIŚNIEWSKI Grzegorz
7
0.30
0.04
26
BADURAK Przemysław Marcin
6
0.26
0.04
27
BULER Weronika Anna
6
0.26
0.04
28
ŁYŻWA Łukasz Kazimierz
5
0.21
0.03
29
BRZOZA Sebastian Krzysztof
3
0.13
0.02
30
PLUTECKI Maciej Jan
0
0.00
0.00
31
MAGDZIARZ Włodzimierz Henryk
12
0.52
0.07
Σ
2284
100.00
13.68
.
.
Voting Results by location of ward electoral commission.
.
.
.
.
.
.
.
.
.
.
.
.
.
.
.
.
.
No.
Name
No. of entitled
to vote
No. of ballot
papers issued
No. of votes
No. of votes: per list / valid [%]
total
valid
per List
1
City
8882
4932
4929
4826
573
11.87
2
Country
28954
12308
12291
11860
1711
14.43
.
Voting Results by number of inhabitants of commune
.
1
to 5 000
4637
1944
1944
1872
695
37.13
2
from 5 001 to 10 000
8311
3383
3383
3259
419
12.86
3
from 10 001 to 20 000
8417
3669
3667
3565
296
8.30
4
from 20 001 to 50 000
16471
8244
8226
7990
874
10.94
5
from 50 001 to 100 000
0
0
0
0
0
0.00
6
from 100 001 to 200 000
0
0
0
0
0
0.00
7
from 200 001 to 500 000
0
0
0
0
0
0.00
8
over 500 000
0
0
0
0
0
0.00
Legal Acts
Documents
Electoral Bodies
Election Committees and Candidates
Turnout
Results
Statistical Data
SENATE
Created by
Copyright © 2007
Mikrobit Sp. z o.o.
. All Rights Reserved.
top