.
.
Legal Acts
Documents
Electoral Bodies
Election Committees and Candidates
Turnout
Results
Statistical Data
SENATE
Created by
.
.
Voting Results
.
.
.
Voting Results for Committee
.
.
.
.
.
.
.
.
.
.
.
.
.
.
.
.
.
.
.
.
Polska
/
Kielce
/
staszowski, pow.
...
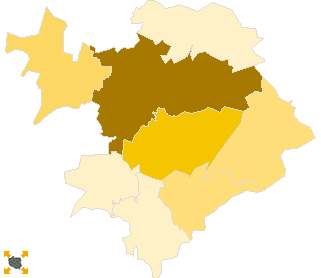
Koalicyjny Komitet Wyborczy Lewica i Demokraci SLD+SDPL+PD+UP
List's Number:
20
No. of valid votes:
24603
No. of votes per List:
3085
12.54%
lack
4.83%
6.18%
7.53%
8.88%
10.23%
11.58%
12.93%
14.28%
15.63%
16.98%
not
of data
6.17%
7.52%
8.87%
10.22%
11.57%
12.92%
14.27%
15.62%
16.97%
18.33%
applicable
See also:
Turnout
Votes per Lists
Votes per Candidates
Information about Election Committee
Election results
Voting Results by location of ward electoral commission
.
.
Voting Results for Committee.
.
.
.
.
.
.
.
.
.
.
.
.
.
.
.
.
.
No.
Name
No. of entitled
to vote
No. of ballot papers
issued
No. of votes
No. of votes: per list / valid [%]
total
valid
per List
261201
Bogoria, gm.
6304
2576
2576
2469
137
5.55
261202
Łubnice, gm.
3494
1447
1447
1396
76
5.44
261203
Oleśnica, gm.
3228
1254
1254
1221
59
4.83
261204
Osiek, gm.
6223
2561
2560
2484
248
9.98
261205
Połaniec, gm.
9607
4331
4331
4204
404
9.61
261206
Rytwiany, gm.
5099
1817
1817
1752
239
13.64
261207
Staszów, gm.
21821
9810
9802
9563
1752
18.32
261208
Szydłów, gm.
4046
1584
1584
1514
170
11.23
staszowski, pow.
59822
25380
25371
24603
3085
12.54
.
.
Voting Results for Candidates
.
.
.
.
.
.
.
.
.
.
.
.
.
.
.
No.
Surname Names
No. of votes
% No. of votes per candidate/No. per list
% No. of votes per candidate/No. of valid votes
1
KOPYCIŃSKI Sławomir Piotr
258
8.36
1.05
2
DUBANIOWSKI Waldemar Jan
179
5.80
0.73
3
STĘPIEŃ Włodzimierz Tadeusz
123
3.98
0.50
4
MILCARZ Henryk Mieczysław
86
2.78
0.35
5
WINIARCZYK-KOSSAKOWSKA Małgorzata Dorota
938
30.40
3.81
6
SUCHAŃSKI Jerzy Zdzisław
38
1.23
0.15
7
SIEJKA Robert
37
1.19
0.15
8
KWIECIEŃ Sylwester Andrzej
14
0.45
0.06
9
KRZYSIEK Zbigniew Stanisław
5
0.16
0.02
10
MARCZEWSKI Sławomir
12
0.38
0.05
11
ISKRA Andrzej
941
30.50
3.82
12
KAMIŃSKA Inga Lidia
20
0.64
0.08
13
MAJCHERCZAK Bogusława Zofia
31
1.00
0.13
14
GAJDA Jan
11
0.35
0.04
15
ŁUDZIK Krystian Kazimierz
9
0.29
0.04
16
KILIAŃSKI Ryszard Ludwik
12
0.38
0.05
17
RURARZ Tomasz
4
0.12
0.02
18
CHODAKOWSKI Piotr Krzysztof
3
0.09
0.01
19
RĘKAS Stanisław Piotr
5
0.16
0.02
20
MARKIEWICZ Bożena Wioletta
17
0.55
0.07
21
ZYGAN Marek Józef
3
0.09
0.01
22
ADAMSKI Krzysztof
4
0.12
0.02
23
GRZYBEK Paweł Stefan
4
0.12
0.02
24
OPAŁKA Zbigniew
281
9.10
1.14
25
WIŚNIEWSKI Grzegorz
11
0.35
0.04
26
BADURAK Przemysław Marcin
4
0.12
0.02
27
BULER Weronika Anna
3
0.09
0.01
28
ŁYŻWA Łukasz Kazimierz
2
0.06
0.01
29
BRZOZA Sebastian Krzysztof
7
0.22
0.03
30
PLUTECKI Maciej Jan
2
0.06
0.01
31
MAGDZIARZ Włodzimierz Henryk
21
0.68
0.09
Σ
3085
100.00
12.53
.
.
Voting Results by location of ward electoral commission.
.
.
.
.
.
.
.
.
.
.
.
.
.
.
.
.
.
No.
Name
No. of entitled
to vote
No. of ballot
papers issued
No. of votes
No. of votes: per list / valid [%]
total
valid
per List
1
City
22003
10945
10937
10714
1687
15.75
2
Country
37819
14435
14434
13889
1398
10.07
.
Voting Results by number of inhabitants of commune
.
1
to 5 000
6722
2701
2701
2617
135
5.16
2
from 5 001 to 10 000
21672
8538
8537
8219
794
9.66
3
from 10 001 to 20 000
9607
4331
4331
4204
404
9.61
4
from 20 001 to 50 000
21821
9810
9802
9563
1752
18.32
5
from 50 001 to 100 000
0
0
0
0
0
0.00
6
from 100 001 to 200 000
0
0
0
0
0
0.00
7
from 200 001 to 500 000
0
0
0
0
0
0.00
8
over 500 000
0
0
0
0
0
0.00
Legal Acts
Documents
Electoral Bodies
Election Committees and Candidates
Turnout
Results
Statistical Data
SENATE
Created by
Copyright © 2007
Mikrobit Sp. z o.o.
. All Rights Reserved.
top