.
.
Legal Acts
Documents
Electoral Bodies
Election Committees and Candidates
Turnout
Results
Statistical Data
SENATE
Created by
.
.
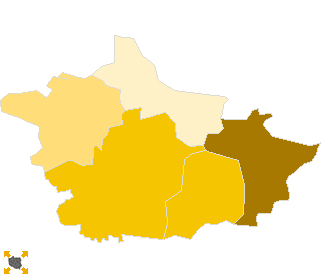
Voting Results
.
.
.
Voting Results for Committee
.
.
.
.
.
.
.
.
.
.
.
.
.
.
.
.
.
.
.
.
Polska
/
Kielce
/
kazimierski, pow.
...
Koalicyjny Komitet Wyborczy Lewica i Demokraci SLD+SDPL+PD+UP
List's Number:
20
No. of valid votes:
10722
No. of votes per List:
962
8.97%
lack
4.39%
5.22%
6.05%
6.88%
7.71%
8.54%
9.37%
10.20%
11.03%
11.86%
not
of data
5.21%
6.04%
6.87%
7.70%
8.53%
9.36%
10.19%
11.02%
11.85%
12.69%
applicable
See also:
Turnout
Votes per Lists
Votes per Candidates
Information about Election Committee
Election results
Voting Results by location of ward electoral commission
.
.
Voting Results for Committee.
.
.
.
.
.
.
.
.
.
.
.
.
.
.
.
.
.
No.
Name
No. of entitled
to vote
No. of ballot papers
issued
No. of votes
No. of votes: per list / valid [%]
total
valid
per List
260301
Bejsce, gm.
3548
1206
1206
1174
113
9.63
260302
Czarnocin, gm.
3479
1461
1456
1412
62
4.39
260303
Kazimierza Wielka, gm.
14045
5303
5302
5161
509
9.86
260304
Opatowiec, gm.
3172
1093
1093
1077
136
12.63
260305
Skalbmierz, gm.
5644
1943
1943
1898
142
7.48
kazimierski, pow.
29888
11006
11000
10722
962
8.97
.
.
Voting Results for Candidates
.
.
.
.
.
.
.
.
.
.
.
.
.
.
.
No.
Surname Names
No. of votes
% No. of votes per candidate/No. per list
% No. of votes per candidate/No. of valid votes
1
KOPYCIŃSKI Sławomir Piotr
120
12.47
1.12
2
DUBANIOWSKI Waldemar Jan
103
10.70
0.96
3
STĘPIEŃ Włodzimierz Tadeusz
88
9.14
0.82
4
MILCARZ Henryk Mieczysław
34
3.53
0.32
5
WINIARCZYK-KOSSAKOWSKA Małgorzata Dorota
48
4.98
0.45
6
SUCHAŃSKI Jerzy Zdzisław
31
3.22
0.29
7
SIEJKA Robert
12
1.24
0.11
8
KWIECIEŃ Sylwester Andrzej
14
1.45
0.13
9
KRZYSIEK Zbigniew Stanisław
3
0.31
0.03
10
MARCZEWSKI Sławomir
7
0.72
0.07
11
ISKRA Andrzej
5
0.51
0.05
12
KAMIŃSKA Inga Lidia
16
1.66
0.15
13
MAJCHERCZAK Bogusława Zofia
269
27.96
2.51
14
GAJDA Jan
17
1.76
0.16
15
ŁUDZIK Krystian Kazimierz
137
14.24
1.28
16
KILIAŃSKI Ryszard Ludwik
3
0.31
0.03
17
RURARZ Tomasz
2
0.20
0.02
18
CHODAKOWSKI Piotr Krzysztof
2
0.20
0.02
19
RĘKAS Stanisław Piotr
0
0.00
0.00
20
MARKIEWICZ Bożena Wioletta
23
2.39
0.21
21
ZYGAN Marek Józef
0
0.00
0.00
22
ADAMSKI Krzysztof
3
0.31
0.03
23
GRZYBEK Paweł Stefan
1
0.10
0.01
24
OPAŁKA Zbigniew
1
0.10
0.01
25
WIŚNIEWSKI Grzegorz
2
0.20
0.02
26
BADURAK Przemysław Marcin
6
0.62
0.06
27
BULER Weronika Anna
3
0.31
0.03
28
ŁYŻWA Łukasz Kazimierz
4
0.41
0.04
29
BRZOZA Sebastian Krzysztof
3
0.31
0.03
30
PLUTECKI Maciej Jan
0
0.00
0.00
31
MAGDZIARZ Włodzimierz Henryk
5
0.51
0.05
Σ
962
100.00
8.97
.
.
Voting Results by location of ward electoral commission.
.
.
.
.
.
.
.
.
.
.
.
.
.
.
.
.
.
No.
Name
No. of entitled
to vote
No. of ballot
papers issued
No. of votes
No. of votes: per list / valid [%]
total
valid
per List
1
City
8124
3517
3516
3425
426
12.44
2
Country
21764
7489
7484
7297
536
7.35
.
Voting Results by number of inhabitants of commune
.
1
to 5 000
10199
3760
3755
3663
311
8.49
2
from 5 001 to 10 000
5644
1943
1943
1898
142
7.48
3
from 10 001 to 20 000
14045
5303
5302
5161
509
9.86
4
from 20 001 to 50 000
0
0
0
0
0
0.00
5
from 50 001 to 100 000
0
0
0
0
0
0.00
6
from 100 001 to 200 000
0
0
0
0
0
0.00
7
from 200 001 to 500 000
0
0
0
0
0
0.00
8
over 500 000
0
0
0
0
0
0.00
Legal Acts
Documents
Electoral Bodies
Election Committees and Candidates
Turnout
Results
Statistical Data
SENATE
Created by
Copyright © 2007
Mikrobit Sp. z o.o.
. All Rights Reserved.
top