.
.
Legal Acts
Documents
Electoral Bodies
Election Committees and Candidates
Turnout
Results
Statistical Data
SENATE
Created by
.
.
Voting Results
.
.
.
Voting Results for Committee
.
.
.
.
.
.
.
.
.
.
.
.
.
.
.
.
.
.
.
.
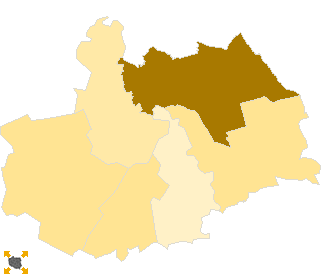
Polska
/
Opole
/
kędzierzyńsko-kozielski, pow.
...
Koalicyjny Komitet Wyborczy Lewica i Demokraci SLD+SDPL+PD+UP
List's Number:
20
No. of valid votes:
36564
No. of votes per List:
5133
14.04%
lack
4.81%
5.98%
7.15%
8.32%
9.49%
10.66%
11.83%
13.00%
14.17%
15.34%
not
of data
5.97%
7.14%
8.31%
9.48%
10.65%
11.82%
12.99%
14.16%
15.33%
16.51%
applicable
See also:
Turnout
Votes per Lists
Votes per Candidates
Information about Election Committee
Election results
Voting Results by location of ward electoral commission
.
.
Voting Results for Committee.
.
.
.
.
.
.
.
.
.
.
.
.
.
.
.
.
.
No.
Name
No. of entitled
to vote
No. of ballot papers
issued
No. of votes
No. of votes: per list / valid [%]
total
valid
per List
160302
Bierawa, gm.
6353
2405
2403
2333
190
8.14
160303
Cisek, gm.
5000
1692
1692
1620
78
4.81
160301
Kędzierzyn-Koźle, m.
51885
27444
27440
26924
4443
16.50
160304
Pawłowiczki, gm.
6822
2223
2223
2127
176
8.27
160305
Polska Cerekiew, gm.
3786
1304
1304
1267
95
7.50
160306
Reńska Wieś, gm.
6848
2353
2351
2293
151
6.59
kędzierzyńsko-kozielski, pow.
80694
37421
37413
36564
5133
14.04
.
.
Voting Results for Candidates
.
.
.
.
.
.
.
.
.
.
.
.
.
.
.
No.
Surname Names
No. of votes
% No. of votes per candidate/No. per list
% No. of votes per candidate/No. of valid votes
1
GARBOWSKI Tomasz
690
13.44
1.89
2
DREWNIAK Alojzy Władysław
119
2.31
0.33
3
MAZUR Andrzej Michał
3045
59.32
8.33
4
ZALASIŃSKI Tomasz
24
0.46
0.07
5
KUBAT Grzegorz
50
0.97
0.14
6
WYCZAŁKOWSKI Bogdan
14
0.27
0.04
7
DUMKIEWICZ Czesław
24
0.46
0.07
8
SEKULA Małgorzata Elżbieta
109
2.12
0.30
9
BAŻYŃSKI Jan Hilary
16
0.31
0.04
10
KOWALCZYK Grzegorz Antoni
27
0.52
0.07
11
TOMALA Dorota Anna
602
11.72
1.65
12
MAJ Roman
30
0.58
0.08
13
SOBIBOROWICZ Wanda
47
0.91
0.13
14
DEC Bogusław Łukasz
49
0.95
0.13
15
MARSZAŁEK Halina Stefania
26
0.50
0.07
16
WOLNY Andrzej Stanisław
32
0.62
0.09
17
MOSOŃ Małgorzata Jolanta
17
0.33
0.05
18
WRZESZYKOWSKI Andrzej Tadeusz
9
0.17
0.02
19
ŚLEPIEŃCZUK Tadeusz
5
0.09
0.01
20
MAŁŁEK Bartosz
15
0.29
0.04
21
MATEJASZEK Leszek Ireneusz
3
0.05
0.01
22
BŁASZCZUK Paweł Piotr
11
0.21
0.03
23
HAUSNER Danuta Czesława
22
0.42
0.06
24
LEŚKIEWICZ Urszula
28
0.54
0.08
25
NAMYSŁO Andrzej
119
2.31
0.33
Σ
5133
100.00
14.03
.
.
Voting Results by location of ward electoral commission.
.
.
.
.
.
.
.
.
.
.
.
.
.
.
.
.
.
No.
Name
No. of entitled
to vote
No. of ballot
papers issued
No. of votes
No. of votes: per list / valid [%]
total
valid
per List
1
City
51885
27444
27440
26924
4443
16.50
2
Country
28809
9977
9973
9640
690
7.16
.
Voting Results by number of inhabitants of commune
.
1
to 5 000
3786
1304
1304
1267
95
7.50
2
from 5 001 to 10 000
25023
8673
8669
8373
595
7.11
3
from 10 001 to 20 000
0
0
0
0
0
0.00
4
from 20 001 to 50 000
0
0
0
0
0
0.00
5
from 50 001 to 100 000
51885
27444
27440
26924
4443
16.50
6
from 100 001 to 200 000
0
0
0
0
0
0.00
7
from 200 001 to 500 000
0
0
0
0
0
0.00
8
over 500 000
0
0
0
0
0
0.00
Legal Acts
Documents
Electoral Bodies
Election Committees and Candidates
Turnout
Results
Statistical Data
SENATE
Created by
Copyright © 2007
Mikrobit Sp. z o.o.
. All Rights Reserved.
top