.
.
Legal Acts
Documents
Electoral Bodies
Election Committees and Candidates
Turnout
Results
Statistical Data
SENATE
Created by
.
.
Voting Results
.
.
.
Voting Results for Committee
.
.
.
.
.
.
.
.
.
.
.
.
.
.
.
.
.
.
.
.
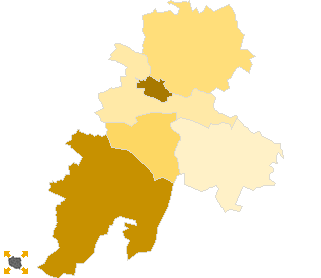
Polska
/
Opole
/
brzeski, pow.
...
Koalicyjny Komitet Wyborczy Lewica i Demokraci SLD+SDPL+PD+UP
List's Number:
20
No. of valid votes:
35112
No. of votes per List:
3764
10.72%
lack
6.48%
7.09%
7.70%
8.31%
8.92%
9.53%
10.14%
10.75%
11.36%
11.97%
not
of data
7.08%
7.69%
8.30%
8.91%
9.52%
10.13%
10.74%
11.35%
11.96%
12.58%
applicable
See also:
Turnout
Votes per Lists
Votes per Candidates
Information about Election Committee
Election results
Voting Results by location of ward electoral commission
.
.
Voting Results for Committee.
.
.
.
.
.
.
.
.
.
.
.
.
.
.
.
.
.
No.
Name
No. of entitled
to vote
No. of ballot papers
issued
No. of votes
No. of votes: per list / valid [%]
total
valid
per List
160101
Brzeg, m.
31103
16737
16732
16502
2075
12.57
160103
Grodków, gm.
15705
6734
6734
6566
775
11.80
160104
Lewin Brzeski, gm.
10462
4831
4828
4688
304
6.48
160105
Lubsza, gm.
6979
3060
3060
2946
245
8.32
160106
Olszanka, gm.
3886
1869
1869
1831
172
9.39
160102
Skarbimierz, gm.
5318
2655
2655
2579
193
7.48
brzeski, pow.
73453
35886
35878
35112
3764
10.72
.
.
Voting Results for Candidates
.
.
.
.
.
.
.
.
.
.
.
.
.
.
.
No.
Surname Names
No. of votes
% No. of votes per candidate/No. per list
% No. of votes per candidate/No. of valid votes
1
GARBOWSKI Tomasz
1660
44.10
4.73
2
DREWNIAK Alojzy Władysław
185
4.91
0.53
3
MAZUR Andrzej Michał
162
4.30
0.46
4
ZALASIŃSKI Tomasz
60
1.59
0.17
5
KUBAT Grzegorz
283
7.51
0.81
6
WYCZAŁKOWSKI Bogdan
20
0.53
0.06
7
DUMKIEWICZ Czesław
56
1.48
0.16
8
SEKULA Małgorzata Elżbieta
153
4.06
0.44
9
BAŻYŃSKI Jan Hilary
11
0.29
0.03
10
KOWALCZYK Grzegorz Antoni
67
1.78
0.19
11
TOMALA Dorota Anna
130
3.45
0.37
12
MAJ Roman
51
1.35
0.15
13
SOBIBOROWICZ Wanda
64
1.70
0.18
14
DEC Bogusław Łukasz
75
1.99
0.21
15
MARSZAŁEK Halina Stefania
180
4.78
0.51
16
WOLNY Andrzej Stanisław
49
1.30
0.14
17
MOSOŃ Małgorzata Jolanta
62
1.64
0.18
18
WRZESZYKOWSKI Andrzej Tadeusz
8
0.21
0.02
19
ŚLEPIEŃCZUK Tadeusz
12
0.31
0.03
20
MAŁŁEK Bartosz
29
0.77
0.08
21
MATEJASZEK Leszek Ireneusz
13
0.34
0.04
22
BŁASZCZUK Paweł Piotr
37
0.98
0.11
23
HAUSNER Danuta Czesława
61
1.62
0.17
24
LEŚKIEWICZ Urszula
50
1.32
0.14
25
NAMYSŁO Andrzej
286
7.59
0.81
Σ
3764
100.00
10.71
.
.
Voting Results by location of ward electoral commission.
.
.
.
.
.
.
.
.
.
.
.
.
.
.
.
.
.
No.
Name
No. of entitled
to vote
No. of ballot
papers issued
No. of votes
No. of votes: per list / valid [%]
total
valid
per List
1
City
44581
23457
23450
23085
2750
11.91
2
Country
28872
12429
12428
12027
1014
8.43
.
Voting Results by number of inhabitants of commune
.
1
to 5 000
3886
1869
1869
1831
172
9.39
2
from 5 001 to 10 000
12297
5715
5715
5525
438
7.93
3
from 10 001 to 20 000
26167
11565
11562
11254
1079
9.59
4
from 20 001 to 50 000
31103
16737
16732
16502
2075
12.57
5
from 50 001 to 100 000
0
0
0
0
0
0.00
6
from 100 001 to 200 000
0
0
0
0
0
0.00
7
from 200 001 to 500 000
0
0
0
0
0
0.00
8
over 500 000
0
0
0
0
0
0.00
Legal Acts
Documents
Electoral Bodies
Election Committees and Candidates
Turnout
Results
Statistical Data
SENATE
Created by
Copyright © 2007
Mikrobit Sp. z o.o.
. All Rights Reserved.
top