|
See also:
|
| . |
. |
Voting Results for Committee. |
. |
. |
| . |
. |
| . |
. |
. |
. |
. |
. |
. |
. |
. |
. |
. |
. |
. |
| No. |
Name |
No. of entitled
to vote |
No. of ballot papers
issued |
No. of votes |
No. of votes: per list / valid [%] |
| total |
valid |
per List |
| 101501 | Bolimów, gm. | 3254 | 1534 | 1533 | 1479 | 113 | 7.64 |  |
| 101502 | Głuchów, gm. | 4792 | 3007 | 3006 | 2911 | 104 | 3.57 | |
| 101503 | Godzianów, gm. | 2079 | 1011 | 1011 | 990 | 57 | 5.76 | |
| 101504 | Kowiesy, gm. | 2450 | 1038 | 1038 | 1008 | 57 | 5.65 | |
| 101505 | Lipce Reymontowskie, gm. | 2660 | 1204 | 1204 | 1173 | 96 | 8.18 | |
| 101506 | Maków, gm. | 4710 | 2188 | 2188 | 2131 | 171 | 8.02 | |
| 101507 | Nowy Kawęczyn, gm. | 2603 | 1137 | 1137 | 1101 | 110 | 9.99 | |
| 101508 | Skierniewice, gm. | 5406 | 2398 | 2397 | 2346 | 154 | 6.56 | |
| 101509 | Słupia, gm. | 2103 | 1006 | 1006 | 978 | 70 | 7.16 | |
| |
skierniewicki, pow. |
30057 |
14523 |
14520 |
14117 |
932 |
6.60 |
 |
|
| |
| . |
. |
Voting Results by location of ward electoral commission. |
. |
. |
| . |
. |
| . |
. |
. |
. |
. |
. |
. |
. |
. |
. |
. |
. |
. |
| No. |
Name |
No. of entitled
to vote |
No. of ballot
papers issued |
No. of votes |
No. of votes: per list / valid [%] |
| total |
valid |
per List |
| 1 | Country | 30057 | 14523 | 14520 | 14117 | 932 | 6.60 | |
| . |
Voting Results by number of inhabitants of commune |
. |
| 1 | to 5 000 | 15149 | 6930 | 6929 | 6729 | 503 | 7.48 | |
| 2 | from 5 001 to 10 000 | 14908 | 7593 | 7591 | 7388 | 429 | 5.81 | |
| 3 | from 10 001 to 20 000 | 0 | 0 | 0 | 0 | 0 | 0.00 | |
| 4 | from 20 001 to 50 000 | 0 | 0 | 0 | 0 | 0 | 0.00 | |
| 5 | from 50 001 to 100 000 | 0 | 0 | 0 | 0 | 0 | 0.00 | |
| 6 | from 100 001 to 200 000 | 0 | 0 | 0 | 0 | 0 | 0.00 | |
| 7 | from 200 001 to 500 000 | 0 | 0 | 0 | 0 | 0 | 0.00 | |
| 8 | over 500 000 | 0 | 0 | 0 | 0 | 0 | 0.00 | |
|
|


 Legal Acts
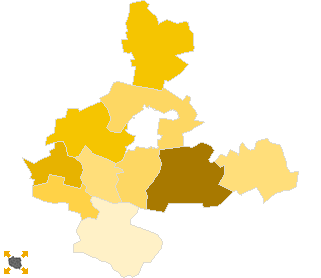
 Legal Acts