.
.
Legal Acts
Documents
Electoral Bodies
Election Committees and Candidates
Turnout
Results
Statistical Data
SENATE
Created by
.
.
Voting Results
.
.
.
Voting Results for Committee
.
.
.
.
.
.
.
.
.
.
.
.
.
.
.
.
.
.
.
.
Polska
/
Zielona Góra
/
świebodziński, pow.
...
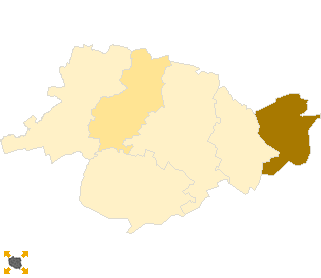
Koalicyjny Komitet Wyborczy Lewica i Demokraci SLD+SDPL+PD+UP
List's Number:
20
No. of valid votes:
20904
No. of votes per List:
3826
18.30%
lack
15.30%
16.97%
18.64%
20.31%
21.98%
23.65%
25.32%
26.99%
28.66%
30.33%
not
of data
16.96%
18.63%
20.30%
21.97%
23.64%
25.31%
26.98%
28.65%
30.32%
32.00%
applicable
See also:
Turnout
Votes per Lists
Votes per Candidates
Information about Election Committee
Election results
Voting Results by location of ward electoral commission
.
.
Voting Results for Committee.
.
.
.
.
.
.
.
.
.
.
.
.
.
.
.
.
.
No.
Name
No. of entitled
to vote
No. of ballot papers
issued
No. of votes
No. of votes: per list / valid [%]
total
valid
per List
080801
Lubrza, gm.
2601
1080
1080
1051
210
19.98
080802
Łagów, gm.
4200
1816
1816
1784
298
16.70
080803
Skąpe, gm.
4081
1743
1741
1699
280
16.48
080804
Szczaniec, gm.
3060
1302
1302
1235
195
15.79
080805
Świebodzin, gm.
23762
12193
12188
11978
1833
15.30
080806
Zbąszynek, gm.
6532
3250
3250
3157
1010
31.99
świebodziński, pow.
44236
21384
21377
20904
3826
18.30
.
.
Voting Results for Candidates
.
.
.
.
.
.
.
.
.
.
.
.
.
.
.
No.
Surname Names
No. of votes
% No. of votes per candidate/No. per list
% No. of votes per candidate/No. of valid votes
1
KOCHANOWSKI Jan
796
20.80
3.81
2
WOJCIUSZKIEWICZ Andrzej
79
2.06
0.38
3
WONTOR Bogusław Tadeusz
1063
27.78
5.09
4
HEBDA Artur Kazimierz
223
5.82
1.07
5
FEDKO Edward Jan
1197
31.28
5.73
6
JASICKA Aleksandra Elżbieta
64
1.67
0.31
7
SKOBELSKI Edward
12
0.31
0.06
8
SŁOWIŃSKI Krzysztof Tadeusz
18
0.47
0.09
9
WINNICKA Mirosława Weronika
63
1.64
0.30
10
EJCHART Dariusz Krystian
18
0.47
0.09
11
POPŁAWSKI Emilian Arkadiusz
18
0.47
0.09
12
JERSAK Karol Piotr
20
0.52
0.10
13
JEZIORSKI Bartłomiej Roland
12
0.31
0.06
14
GABRYELCZYK Tadeusz Stanisław
10
0.26
0.05
15
KĄKALEC Tadeusz
4
0.10
0.02
16
KOPIJ Marlena Barbara
14
0.36
0.07
17
SERAFIN Danuta
37
0.96
0.18
18
SANECKI Jarosław
19
0.49
0.09
19
ADAMCZYK Irena Lidia
38
0.99
0.18
20
ALEKSANDROWICZ Hieronim
19
0.49
0.09
21
JABŁOŃSKA-BEDYNEK Katarzyna
35
0.91
0.17
22
BIERNAT Władysław Tadeusz
16
0.41
0.08
23
DOSZEL Grzegorz Stanisław
6
0.15
0.03
24
DUBACKI Mariusz
45
1.17
0.22
Σ
3826
100.00
18.30
.
.
Voting Results by location of ward electoral commission.
.
.
.
.
.
.
.
.
.
.
.
.
.
.
.
.
.
No.
Name
No. of entitled
to vote
No. of ballot
papers issued
No. of votes
No. of votes: per list / valid [%]
total
valid
per List
1
City
21608
11864
11859
11674
2189
18.75
2
Country
22628
9520
9518
9230
1637
17.74
.
Voting Results by number of inhabitants of commune
.
1
to 5 000
5661
2382
2382
2286
405
17.72
2
from 5 001 to 10 000
14813
6809
6807
6640
1588
23.92
3
from 10 001 to 20 000
0
0
0
0
0
0.00
4
from 20 001 to 50 000
23762
12193
12188
11978
1833
15.30
5
from 50 001 to 100 000
0
0
0
0
0
0.00
6
from 100 001 to 200 000
0
0
0
0
0
0.00
7
from 200 001 to 500 000
0
0
0
0
0
0.00
8
over 500 000
0
0
0
0
0
0.00
Legal Acts
Documents
Electoral Bodies
Election Committees and Candidates
Turnout
Results
Statistical Data
SENATE
Created by
Copyright © 2007
Mikrobit Sp. z o.o.
. All Rights Reserved.
top