.
.
Legal Acts
Documents
Electoral Bodies
Election Committees and Candidates
Turnout
Results
Statistical Data
SENATE
Created by
.
.
Voting Results
.
.
.
Voting Results for Committee
.
.
.
.
.
.
.
.
.
.
.
.
.
.
.
.
.
.
.
.
Polska
/
Zielona Góra
/
nowosolski, pow.
...
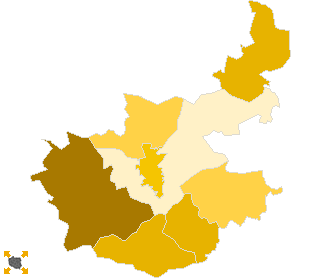
Koalicyjny Komitet Wyborczy Lewica i Demokraci SLD+SDPL+PD+UP
List's Number:
20
No. of valid votes:
32708
No. of votes per List:
4336
13.26%
lack
7.17%
8.05%
8.93%
9.81%
10.69%
11.57%
12.45%
13.33%
14.21%
15.09%
not
of data
8.04%
8.92%
9.80%
10.68%
11.56%
12.44%
13.32%
14.20%
15.08%
15.97%
applicable
See also:
Turnout
Votes per Lists
Votes per Candidates
Information about Election Committee
Election results
Voting Results by location of ward electoral commission
.
.
Voting Results for Committee.
.
.
.
.
.
.
.
.
.
.
.
.
.
.
.
.
.
No.
Name
No. of entitled
to vote
No. of ballot papers
issued
No. of votes
No. of votes: per list / valid [%]
total
valid
per List
080402
Bytom Odrzański, gm.
4184
1923
1923
1863
264
14.17
080403
Kolsko, gm.
2545
1068
1068
1014
141
13.91
080404
Kożuchów, gm.
12614
5449
5447
5309
843
15.88
080405
Nowa Sól, gm.
5131
2247
2247
2189
157
7.17
080401
Nowa Sól, m.
32965
17688
17630
17351
2294
13.22
080406
Nowe Miasteczko, gm.
4340
1954
1954
1907
264
13.84
080407
Otyń, gm.
4583
2084
2084
2012
241
11.98
080408
Siedlisko, gm.
2639
1105
1105
1063
132
12.42
nowosolski, pow.
69001
33518
33458
32708
4336
13.26
.
.
Voting Results for Candidates
.
.
.
.
.
.
.
.
.
.
.
.
.
.
.
No.
Surname Names
No. of votes
% No. of votes per candidate/No. per list
% No. of votes per candidate/No. of valid votes
1
KOCHANOWSKI Jan
938
21.63
2.87
2
WOJCIUSZKIEWICZ Andrzej
212
4.88
0.65
3
WONTOR Bogusław Tadeusz
913
21.05
2.79
4
HEBDA Artur Kazimierz
411
9.47
1.26
5
FEDKO Edward Jan
578
13.33
1.77
6
JASICKA Aleksandra Elżbieta
113
2.60
0.35
7
SKOBELSKI Edward
13
0.29
0.04
8
SŁOWIŃSKI Krzysztof Tadeusz
35
0.80
0.11
9
WINNICKA Mirosława Weronika
95
2.19
0.29
10
EJCHART Dariusz Krystian
16
0.36
0.05
11
POPŁAWSKI Emilian Arkadiusz
48
1.10
0.15
12
JERSAK Karol Piotr
22
0.50
0.07
13
JEZIORSKI Bartłomiej Roland
24
0.55
0.07
14
GABRYELCZYK Tadeusz Stanisław
556
12.82
1.70
15
KĄKALEC Tadeusz
13
0.29
0.04
16
KOPIJ Marlena Barbara
22
0.50
0.07
17
SERAFIN Danuta
56
1.29
0.17
18
SANECKI Jarosław
16
0.36
0.05
19
ADAMCZYK Irena Lidia
39
0.89
0.12
20
ALEKSANDROWICZ Hieronim
21
0.48
0.06
21
JABŁOŃSKA-BEDYNEK Katarzyna
52
1.19
0.16
22
BIERNAT Władysław Tadeusz
43
0.99
0.13
23
DOSZEL Grzegorz Stanisław
46
1.06
0.14
24
DUBACKI Mariusz
54
1.24
0.17
Σ
4336
100.00
13.25
.
.
Voting Results by location of ward electoral commission.
.
.
.
.
.
.
.
.
.
.
.
.
.
.
.
.
.
No.
Name
No. of entitled
to vote
No. of ballot
papers issued
No. of votes
No. of votes: per list / valid [%]
total
valid
per List
1
City
48746
25041
24981
24504
3446
14.06
2
Country
20255
8477
8477
8204
890
10.85
.
Voting Results by number of inhabitants of commune
.
1
to 5 000
5184
2173
2173
2077
273
13.14
2
from 5 001 to 10 000
18238
8208
8208
7971
926
11.62
3
from 10 001 to 20 000
12614
5449
5447
5309
843
15.88
4
from 20 001 to 50 000
32965
17688
17630
17351
2294
13.22
5
from 50 001 to 100 000
0
0
0
0
0
0.00
6
from 100 001 to 200 000
0
0
0
0
0
0.00
7
from 200 001 to 500 000
0
0
0
0
0
0.00
8
over 500 000
0
0
0
0
0
0.00
Legal Acts
Documents
Electoral Bodies
Election Committees and Candidates
Turnout
Results
Statistical Data
SENATE
Created by
Copyright © 2007
Mikrobit Sp. z o.o.
. All Rights Reserved.
top