.
.
 
. .
Voting Results
.
. . Voting Results for Committee . .
. .
. . . . . . . . . . . . . . . .
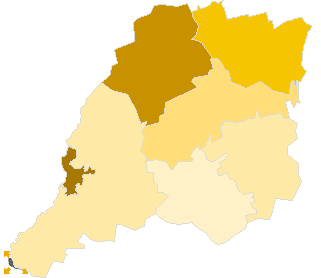
Polska / Zielona Góra / krośnieński, pow. ...
Koalicyjny Komitet Wyborczy Lewica i Demokraci SLD+SDPL+PD+UP
List's Number: 20
No. of valid votes: 19920
No. of votes per List: 3416
17.15%
lack11.81%12.80%13.79%14.78%15.77%16.76%17.75%18.74%19.73%20.72%not
of data12.79%13.78%14.77%15.76%16.75%17.74%18.73%19.72%20.71%21.71%applicable

See also:
. . Voting Results for Committee. . .
. .
. . . . . . . . . . . . .
No. Name No. of entitled
to vote
No. of ballot papers
issued
No. of votes No. of votes: per list / valid [%]
total valid per List
080202Bobrowice, gm.257410591059101612011.81
080203Bytnica, gm.209177977974913618.16
080204Dąbie, gm.394116151615154720012.93
080205Gubin, gm.567921662165211027613.08
080201Gubin, m.13525670667066551141621.62
080206Krosno Odrzańskie, gm.14998748774847309113915.58
080207Maszewo, gm.234067367363812920.22
  krośnieński, pow. 45148 20485 20481 19920 3416 17.15

. . Voting Results for Candidates . .
. .
. . . . . . . . . . .
No. Surname Names No. of votes % No. of votes per candidate/No. per list % No. of votes per candidate/No. of valid votes
1KOCHANOWSKI Jan62018.143.11
2WOJCIUSZKIEWICZ Andrzej822.400.41
3WONTOR Bogusław Tadeusz168249.238.44
4HEBDA Artur Kazimierz2707.901.36
5FEDKO Edward Jan2246.551.12
6JASICKA Aleksandra Elżbieta892.600.45
7SKOBELSKI Edward320.930.16
8SŁOWIŃSKI Krzysztof Tadeusz300.870.15
9WINNICKA Mirosława Weronika651.900.33
10EJCHART Dariusz Krystian50.140.03
11POPŁAWSKI Emilian Arkadiusz130.380.07
12JERSAK Karol Piotr230.670.12
13JEZIORSKI Bartłomiej Roland361.050.18
14GABRYELCZYK Tadeusz Stanisław90.260.05
15KĄKALEC Tadeusz100.290.05
16KOPIJ Marlena Barbara190.550.10
17SERAFIN Danuta361.050.18
18SANECKI Jarosław110.320.06
19ADAMCZYK Irena Lidia541.580.27
20ALEKSANDROWICZ Hieronim190.550.10
21JABŁOŃSKA-BEDYNEK Katarzyna411.200.21
22BIERNAT Władysław Tadeusz70.200.04
23DOSZEL Grzegorz Stanisław50.140.03
24DUBACKI Mariusz340.990.17
Σ   3416 100.00 17.14
 
. . Voting Results by location of ward electoral commission. . .
. .
. . . . . . . . . . . . .
No. Name No. of entitled
to vote
No. of ballot
papers issued
No. of votes No. of votes: per list / valid [%]
total valid per List
1City23518121641216111886231519.48
2Country21630832183208034110113.70
. Voting Results by number of inhabitants of commune .
1to 5 000700525112511240338516.02
2from 5 001 to 10 000962037813780365747613.02
3from 10 001 to 20 00028523141931419013860255518.43
4from 20 001 to 50 000000000.00 
5from 50 001 to 100 000000000.00 
6from 100 001 to 200 000000000.00 
7from 200 001 to 500 000000000.00 
8over 500 000000000.00 

  Legal Acts Documents Electoral Bodies Election Committees and Candidates Turnout Results Statistical Data SENATE Created by
 top