.
.
Legal Acts
Documents
Electoral Bodies
Election Committees and Candidates
Turnout
Results
Statistical Data
SENATE
Created by
.
.
Voting Results
.
.
.
Voting Results for Committee
.
.
.
.
.
.
.
.
.
.
.
.
.
.
.
.
.
.
.
.
Polska
/
Bydgoszcz
/
żniński, pow.
...
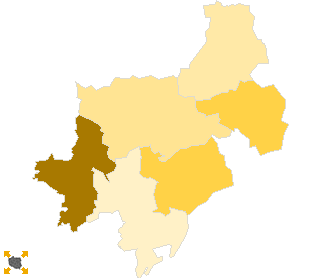
Koalicyjny Komitet Wyborczy Lewica i Demokraci SLD+SDPL+PD+UP
List's Number:
20
No. of valid votes:
25621
No. of votes per List:
5215
20.35%
lack
12.39%
14.51%
16.63%
18.75%
20.87%
22.99%
25.11%
27.23%
29.35%
31.47%
not
of data
14.50%
16.62%
18.74%
20.86%
22.98%
25.10%
27.22%
29.34%
31.46%
33.59%
applicable
See also:
Turnout
Votes per Lists
Votes per Candidates
Information about Election Committee
Election results
Voting Results by location of ward electoral commission
.
.
Voting Results for Committee.
.
.
.
.
.
.
.
.
.
.
.
.
.
.
.
.
.
No.
Name
No. of entitled
to vote
No. of ballot papers
issued
No. of votes
No. of votes: per list / valid [%]
total
valid
per List
041901
Barcin, gm.
11712
5471
5457
5338
1288
24.13
041902
Gąsawa, gm.
4109
1920
1920
1851
434
23.45
041903
Janowiec Wielkopolski, gm.
7497
3418
3416
3258
1094
33.58
041904
Łabiszyn, gm.
7261
3253
3253
3159
510
16.14
041905
Rogowo, gm.
5373
2791
2791
2655
329
12.39
041906
Żnin, gm.
19364
9709
9706
9360
1560
16.67
żniński, pow.
55316
26562
26543
25621
5215
20.35
.
.
Voting Results for Candidates
.
.
.
.
.
.
.
.
.
.
.
.
.
.
.
No.
Surname Names
No. of votes
% No. of votes per candidate/No. per list
% No. of votes per candidate/No. of valid votes
1
ZEMKE Janusz Władysław
1410
27.03
5.50
2
BAŃKOWSKA Anna Danuta
506
9.70
1.97
3
CIEMNIAK Grażyna Jolanta
137
2.62
0.53
4
TURSKI Jan Edward
65
1.24
0.25
5
MICHALAK Dawid Maciej
58
1.11
0.23
6
NITKIEWICZ Ireneusz Michał
51
0.97
0.20
7
MACIEJEWSKI Leonard
33
0.63
0.13
8
ORTMANN Jerzy Michał
9
0.17
0.04
9
BRANICKI Janusz
14
0.26
0.05
10
HEMMERLING Piotr Andrzej
32
0.61
0.12
11
KIEDROWSKI Janusz Roman
7
0.13
0.03
12
BOROWSKA Joanna Małgorzata
43
0.82
0.17
13
PAWŁOWSKI Roman Tadeusz
79
1.51
0.31
14
OSIŃSKA Regina Anna
28
0.53
0.11
15
LEWANDOWSKA Jadwiga
92
1.76
0.36
16
PICHŁACZ Grzegorz Marian
31
0.59
0.12
17
TYLICKI Zdzisław
10
0.19
0.04
18
KOŁODZIEJSKI Henryk
18
0.34
0.07
19
TACIAK Sława
14
0.26
0.05
20
KUFEL Grażyna Mirosława
49
0.93
0.19
21
ŁAPIŃSKA Ewa
36
0.69
0.14
22
FANDREJEWSKI Marek Stanisław
2
0.03
0.01
23
JASZCZUK Zbigniew
2288
43.87
8.93
24
JENERALSKI Sławomir Bogusław
203
3.89
0.79
Σ
5215
100.00
20.35
.
.
Voting Results by location of ward electoral commission.
.
.
.
.
.
.
.
.
.
.
.
.
.
.
.
.
.
No.
Name
No. of entitled
to vote
No. of ballot
papers issued
No. of votes
No. of votes: per list / valid [%]
total
valid
per List
1
City
25109
13165
13148
12750
2818
22.10
2
Country
30207
13397
13395
12871
2397
18.62
.
Voting Results by number of inhabitants of commune
.
1
to 5 000
0
0
0
0
0
0.00
2
from 5 001 to 10 000
24240
11382
11380
10923
2367
21.67
3
from 10 001 to 20 000
11712
5471
5457
5338
1288
24.13
4
from 20 001 to 50 000
19364
9709
9706
9360
1560
16.67
5
from 50 001 to 100 000
0
0
0
0
0
0.00
6
from 100 001 to 200 000
0
0
0
0
0
0.00
7
from 200 001 to 500 000
0
0
0
0
0
0.00
8
over 500 000
0
0
0
0
0
0.00
Legal Acts
Documents
Electoral Bodies
Election Committees and Candidates
Turnout
Results
Statistical Data
SENATE
Created by
Copyright © 2007
Mikrobit Sp. z o.o.
. All Rights Reserved.
top