.
.
Legal Acts
Documents
Electoral Bodies
Election Committees and Candidates
Turnout
Results
Statistical Data
SENATE
Created by
.
.
Voting Results
.
.
.
Voting Results for Committee
.
.
.
.
.
.
.
.
.
.
.
.
.
.
.
.
.
.
.
.
Polska
/
Bydgoszcz
/
sępoleński, pow.
...
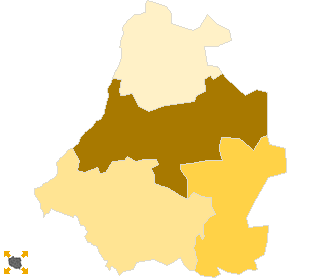
Koalicyjny Komitet Wyborczy Lewica i Demokraci SLD+SDPL+PD+UP
List's Number:
20
No. of valid votes:
13994
No. of votes per List:
2335
16.69%
lack
14.26%
14.69%
15.12%
15.55%
15.98%
16.41%
16.84%
17.27%
17.70%
18.13%
not
of data
14.68%
15.11%
15.54%
15.97%
16.40%
16.83%
17.26%
17.69%
18.12%
18.56%
applicable
See also:
Turnout
Votes per Lists
Votes per Candidates
Information about Election Committee
Election results
Voting Results by location of ward electoral commission
.
.
Voting Results for Committee.
.
.
.
.
.
.
.
.
.
.
.
.
.
.
.
.
.
No.
Name
No. of entitled
to vote
No. of ballot papers
issued
No. of votes
No. of votes: per list / valid [%]
total
valid
per List
041301
Kamień Krajeński, gm.
5317
2233
2233
2124
303
14.27
041302
Sępólno Krajeńskie, gm.
12524
5928
5927
5758
1063
18.46
041303
Sośno, gm.
4022
1612
1612
1549
260
16.79
041304
Więcbork, gm.
10316
4692
4689
4563
709
15.54
sępoleński, pow.
32179
14465
14461
13994
2335
16.69
.
.
Voting Results for Candidates
.
.
.
.
.
.
.
.
.
.
.
.
.
.
.
No.
Surname Names
No. of votes
% No. of votes per candidate/No. per list
% No. of votes per candidate/No. of valid votes
1
ZEMKE Janusz Władysław
999
42.78
7.14
2
BAŃKOWSKA Anna Danuta
223
9.55
1.59
3
CIEMNIAK Grażyna Jolanta
139
5.95
0.99
4
TURSKI Jan Edward
42
1.79
0.30
5
MICHALAK Dawid Maciej
50
2.14
0.36
6
NITKIEWICZ Ireneusz Michał
13
0.55
0.09
7
MACIEJEWSKI Leonard
31
1.32
0.22
8
ORTMANN Jerzy Michał
12
0.51
0.09
9
BRANICKI Janusz
11
0.47
0.08
10
HEMMERLING Piotr Andrzej
16
0.68
0.11
11
KIEDROWSKI Janusz Roman
67
2.86
0.48
12
BOROWSKA Joanna Małgorzata
45
1.92
0.32
13
PAWŁOWSKI Roman Tadeusz
54
2.31
0.39
14
OSIŃSKA Regina Anna
28
1.19
0.20
15
LEWANDOWSKA Jadwiga
45
1.92
0.32
16
PICHŁACZ Grzegorz Marian
150
6.42
1.07
17
TYLICKI Zdzisław
22
0.94
0.16
18
KOŁODZIEJSKI Henryk
11
0.47
0.08
19
TACIAK Sława
6
0.25
0.04
20
KUFEL Grażyna Mirosława
46
1.97
0.33
21
ŁAPIŃSKA Ewa
15
0.64
0.11
22
FANDREJEWSKI Marek Stanisław
2
0.08
0.01
23
JASZCZUK Zbigniew
11
0.47
0.08
24
JENERALSKI Sławomir Bogusław
297
12.71
2.12
Σ
2335
100.00
16.68
.
.
Voting Results by location of ward electoral commission.
.
.
.
.
.
.
.
.
.
.
.
.
.
.
.
.
.
No.
Name
No. of entitled
to vote
No. of ballot
papers issued
No. of votes
No. of votes: per list / valid [%]
total
valid
per List
1
City
15341
7807
7805
7556
1299
17.19
2
Country
16838
6658
6656
6438
1036
16.09
.
Voting Results by number of inhabitants of commune
.
1
to 5 000
0
0
0
0
0
0.00
2
from 5 001 to 10 000
9339
3845
3845
3673
563
15.33
3
from 10 001 to 20 000
22840
10620
10616
10321
1772
17.17
4
from 20 001 to 50 000
0
0
0
0
0
0.00
5
from 50 001 to 100 000
0
0
0
0
0
0.00
6
from 100 001 to 200 000
0
0
0
0
0
0.00
7
from 200 001 to 500 000
0
0
0
0
0
0.00
8
over 500 000
0
0
0
0
0
0.00
Legal Acts
Documents
Electoral Bodies
Election Committees and Candidates
Turnout
Results
Statistical Data
SENATE
Created by
Copyright © 2007
Mikrobit Sp. z o.o.
. All Rights Reserved.
top