.
.
Legal Acts
Documents
Electoral Bodies
Election Committees and Candidates
Turnout
Results
Statistical Data
SENATE
Created by
.
.
Voting Results
.
.
.
Voting Results for Committee
.
.
.
.
.
.
.
.
.
.
.
.
.
.
.
.
.
.
.
.
Polska
/
Bydgoszcz
/
nakielski, pow.
...
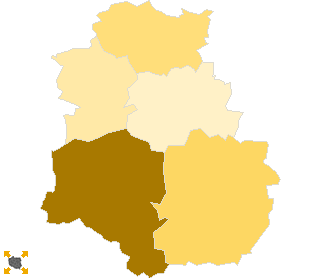
Koalicyjny Komitet Wyborczy Lewica i Demokraci SLD+SDPL+PD+UP
List's Number:
20
No. of valid votes:
31786
No. of votes per List:
6400
20.13%
lack
18.35%
18.93%
19.51%
20.09%
20.67%
21.25%
21.83%
22.41%
22.99%
23.57%
not
of data
18.92%
19.50%
20.08%
20.66%
21.24%
21.82%
22.40%
22.98%
23.56%
24.15%
applicable
See also:
Turnout
Votes per Lists
Votes per Candidates
Information about Election Committee
Election results
Voting Results by location of ward electoral commission
.
.
Voting Results for Committee.
.
.
.
.
.
.
.
.
.
.
.
.
.
.
.
.
.
No.
Name
No. of entitled
to vote
No. of ballot papers
issued
No. of votes
No. of votes: per list / valid [%]
total
valid
per List
041001
Kcynia, gm.
10628
4842
4842
4659
1124
24.13
041002
Mrocza, gm.
6912
3066
3065
2946
607
20.60
041003
Nakło nad Notecią, gm.
26792
13784
13784
13456
2470
18.36
041004
Sadki, gm.
5499
2415
2415
2333
450
19.29
041005
Szubin, gm.
17611
8623
8620
8392
1749
20.84
nakielski, pow.
67442
32730
32726
31786
6400
20.13
.
.
Voting Results for Candidates
.
.
.
.
.
.
.
.
.
.
.
.
.
.
.
No.
Surname Names
No. of votes
% No. of votes per candidate/No. per list
% No. of votes per candidate/No. of valid votes
1
ZEMKE Janusz Władysław
3381
52.82
10.64
2
BAŃKOWSKA Anna Danuta
240
3.75
0.76
3
CIEMNIAK Grażyna Jolanta
198
3.09
0.62
4
TURSKI Jan Edward
81
1.26
0.25
5
MICHALAK Dawid Maciej
79
1.23
0.25
6
NITKIEWICZ Ireneusz Michał
24
0.37
0.08
7
MACIEJEWSKI Leonard
37
0.57
0.12
8
ORTMANN Jerzy Michał
12
0.18
0.04
9
BRANICKI Janusz
8
0.12
0.03
10
HEMMERLING Piotr Andrzej
1664
26.00
5.24
11
KIEDROWSKI Janusz Roman
16
0.25
0.05
12
BOROWSKA Joanna Małgorzata
58
0.90
0.18
13
PAWŁOWSKI Roman Tadeusz
104
1.62
0.33
14
OSIŃSKA Regina Anna
48
0.75
0.15
15
LEWANDOWSKA Jadwiga
67
1.04
0.21
16
PICHŁACZ Grzegorz Marian
27
0.42
0.08
17
TYLICKI Zdzisław
24
0.37
0.08
18
KOŁODZIEJSKI Henryk
25
0.39
0.08
19
TACIAK Sława
12
0.18
0.04
20
KUFEL Grażyna Mirosława
59
0.92
0.19
21
ŁAPIŃSKA Ewa
42
0.65
0.13
22
FANDREJEWSKI Marek Stanisław
8
0.12
0.03
23
JASZCZUK Zbigniew
11
0.17
0.03
24
JENERALSKI Sławomir Bogusław
175
2.73
0.55
Σ
6400
100.00
20.13
.
.
Voting Results by location of ward electoral commission.
.
.
.
.
.
.
.
.
.
.
.
.
.
.
.
.
.
No.
Name
No. of entitled
to vote
No. of ballot
papers issued
No. of votes
No. of votes: per list / valid [%]
total
valid
per List
1
City
32505
17270
17266
16780
3261
19.43
2
Country
34937
15460
15460
15006
3139
20.92
.
Voting Results by number of inhabitants of commune
.
1
to 5 000
0
0
0
0
0
0.00
2
from 5 001 to 10 000
12411
5481
5480
5279
1057
20.02
3
from 10 001 to 20 000
10628
4842
4842
4659
1124
24.13
4
from 20 001 to 50 000
44403
22407
22404
21848
4219
19.31
5
from 50 001 to 100 000
0
0
0
0
0
0.00
6
from 100 001 to 200 000
0
0
0
0
0
0.00
7
from 200 001 to 500 000
0
0
0
0
0
0.00
8
over 500 000
0
0
0
0
0
0.00
Legal Acts
Documents
Electoral Bodies
Election Committees and Candidates
Turnout
Results
Statistical Data
SENATE
Created by
Copyright © 2007
Mikrobit Sp. z o.o.
. All Rights Reserved.
top