.
.
Legal Acts
Documents
Electoral Bodies
Election Committees and Candidates
Turnout
Results
Statistical Data
SENATE
Created by
.
.
Voting Results
.
.
.
Voting Results for Committee
.
.
.
.
.
.
.
.
.
.
.
.
.
.
.
.
.
.
.
.
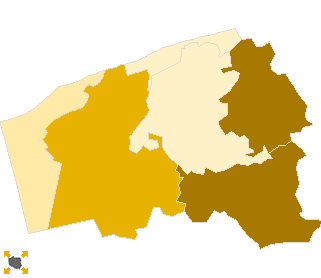
Polska
/
Szczecin
/
kamieński, pow.
...
Komitet Wyborczy Polskiego Stronnictwa Ludowego
List's Number:
10
No. of valid votes:
18026
No. of votes per List:
1236
6.86%
lack
4.91%
5.44%
5.97%
6.50%
7.03%
7.56%
8.09%
8.62%
9.15%
9.68%
not
of data
5.43%
5.96%
6.49%
7.02%
7.55%
8.08%
8.61%
9.14%
9.67%
10.21%
applicable
See also:
Turnout
Votes per Lists
Votes per Candidates
Information about Election Committee
Election results
Voting Results by location of ward electoral commission
.
.
Voting Results for Committee.
.
.
.
.
.
.
.
.
.
.
.
.
.
.
.
.
.
No.
Name
No. of entitled
to vote
No. of ballot papers
issued
No. of votes
No. of votes: per list / valid [%]
total
valid
per List
320701
Dziwnów, gm.
3576
1996
1996
1912
94
4.92
320702
Golczewo, gm.
4813
2038
2038
1967
199
10.12
320703
Kamień Pomorski, gm.
12167
5969
5969
5845
292
5.00
320704
Międzyzdroje, gm.
5485
2898
2898
2829
162
5.73
320705
Świerzno, gm.
3314
1231
1231
1195
117
9.79
320706
Wolin, gm.
9974
4383
4377
4278
372
8.70
kamieński, pow.
39329
18515
18509
18026
1236
6.86
.
.
Voting Results for Candidates
.
.
.
.
.
.
.
.
.
.
.
.
.
.
.
No.
Surname Names
No. of votes
% No. of votes per candidate/No. per list
% No. of votes per candidate/No. of valid votes
1
ZIEMBA Kazimierz
309
25.00
1.71
2
DZIEWGUĆ Zygmunt
96
7.76
0.53
3
UDAŁA Jan Mieczysław
77
6.22
0.43
4
SADŁOWSKI Edward Stanisław
40
3.23
0.22
5
RUCIŃSKI Witold
27
2.18
0.15
6
POMIECZYŃSKI Zbigniew Rajmund
92
7.44
0.51
7
TOKARZEWSKA Beata Tamara
61
4.93
0.34
8
KARŁOWSKI Michał
12
0.97
0.07
9
MLECZKO Andrzej Józef
200
16.18
1.11
10
JANOWICZ Arkadiusz Zygmunt
33
2.66
0.18
11
SYPIEŃ Mieczysław
23
1.86
0.13
12
ŁOZIŃSKA-RESZKOWSKA Małgorzata
33
2.66
0.18
13
TOSZEK Bartłomiej Henryk
8
0.64
0.04
14
FOJNA Mieczysław
4
0.32
0.02
15
BALCERZAK Krystyna
26
2.10
0.14
16
JAKUBOWSKI Józef
16
1.29
0.09
17
MACHEROWSKI Eugeniusz Jan
7
0.56
0.04
18
KAWCEWICZ Agnieszka Joanna
13
1.05
0.07
19
GAJEWSKI Marek Zdzisław
7
0.56
0.04
20
KOCZAN Ireneusz Marian
18
1.45
0.10
21
SIDOR Andrzej Sławomir
6
0.48
0.03
22
DĘBSKA Beata Teresa
21
1.69
0.12
23
KOWALCZYK-DWORZYŃSKA Malwina
12
0.97
0.07
24
PRZYBYŁOWICZ Roman Józef
1
0.08
0.01
25
SAWICKI Andrzej Dariusz
22
1.77
0.12
26
DURKA Andrzej Zdzisław
72
5.82
0.40
Σ
1236
100.00
6.85
.
.
Voting Results by location of ward electoral commission.
.
.
.
.
.
.
.
.
.
.
.
.
.
.
.
.
.
No.
Name
No. of entitled
to vote
No. of ballot
papers issued
No. of votes
No. of votes: per list / valid [%]
total
valid
per List
1
City
22254
11626
11620
11351
630
5.55
2
Country
17075
6889
6889
6675
606
9.08
.
Voting Results by number of inhabitants of commune
.
1
to 5 000
6890
3227
3227
3107
211
6.79
2
from 5 001 to 10 000
10298
4936
4936
4796
361
7.53
3
from 10 001 to 20 000
22141
10352
10346
10123
664
6.56
4
from 20 001 to 50 000
0
0
0
0
0
0.00
5
from 50 001 to 100 000
0
0
0
0
0
0.00
6
from 100 001 to 200 000
0
0
0
0
0
0.00
7
from 200 001 to 500 000
0
0
0
0
0
0.00
8
over 500 000
0
0
0
0
0
0.00
Legal Acts
Documents
Electoral Bodies
Election Committees and Candidates
Turnout
Results
Statistical Data
SENATE
Created by
Copyright © 2007
Mikrobit Sp. z o.o.
. All Rights Reserved.
top