.
.
Legal Acts
Documents
Electoral Bodies
Election Committees and Candidates
Turnout
Results
Statistical Data
SENATE
Created by
.
.
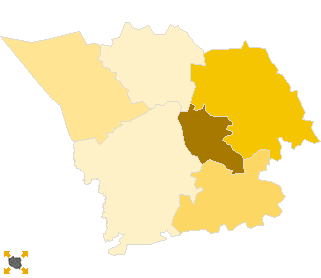
Voting Results
.
.
.
Voting Results for Committee
.
.
.
.
.
.
.
.
.
.
.
.
.
.
.
.
.
.
.
.
Polska
/
Szczecin
/
goleniowski, pow.
...
Komitet Wyborczy Polskiego Stronnictwa Ludowego
List's Number:
10
No. of valid votes:
29723
No. of votes per List:
3370
11.34%
lack
6.77%
8.37%
9.97%
11.57%
13.17%
14.77%
16.37%
17.97%
19.57%
21.17%
not
of data
8.36%
9.96%
11.56%
13.16%
14.76%
16.36%
17.96%
19.56%
21.16%
22.77%
applicable
See also:
Turnout
Votes per Lists
Votes per Candidates
Information about Election Committee
Election results
Voting Results by location of ward electoral commission
.
.
Voting Results for Committee.
.
.
.
.
.
.
.
.
.
.
.
.
.
.
.
.
.
No.
Name
No. of entitled
to vote
No. of ballot papers
issued
No. of votes
No. of votes: per list / valid [%]
total
valid
per List
320402
Goleniów, gm.
27329
14470
14468
14209
962
6.77
320403
Maszewo, gm.
6215
2461
2461
2398
335
13.97
320404
Nowogard, gm.
19930
9535
9516
9284
1600
17.23
320405
Osina, gm.
2206
941
941
911
207
22.72
320406
Przybiernów, gm.
4135
1585
1585
1536
122
7.94
320407
Stepnica, gm.
3750
1429
1429
1385
144
10.40
goleniowski, pow.
63565
30421
30400
29723
3370
11.34
.
.
Voting Results for Candidates
.
.
.
.
.
.
.
.
.
.
.
.
.
.
.
No.
Surname Names
No. of votes
% No. of votes per candidate/No. per list
% No. of votes per candidate/No. of valid votes
1
ZIEMBA Kazimierz
1876
55.66
6.31
2
DZIEWGUĆ Zygmunt
95
2.81
0.32
3
UDAŁA Jan Mieczysław
37
1.09
0.12
4
SADŁOWSKI Edward Stanisław
34
1.00
0.11
5
RUCIŃSKI Witold
26
0.77
0.09
6
POMIECZYŃSKI Zbigniew Rajmund
28
0.83
0.09
7
TOKARZEWSKA Beata Tamara
82
2.43
0.28
8
KARŁOWSKI Michał
18
0.53
0.06
9
MLECZKO Andrzej Józef
28
0.83
0.09
10
JANOWICZ Arkadiusz Zygmunt
31
0.91
0.10
11
SYPIEŃ Mieczysław
736
21.83
2.48
12
ŁOZIŃSKA-RESZKOWSKA Małgorzata
28
0.83
0.09
13
TOSZEK Bartłomiej Henryk
19
0.56
0.06
14
FOJNA Mieczysław
15
0.44
0.05
15
BALCERZAK Krystyna
25
0.74
0.08
16
JAKUBOWSKI Józef
25
0.74
0.08
17
MACHEROWSKI Eugeniusz Jan
11
0.32
0.04
18
KAWCEWICZ Agnieszka Joanna
33
0.97
0.11
19
GAJEWSKI Marek Zdzisław
17
0.50
0.06
20
KOCZAN Ireneusz Marian
12
0.35
0.04
21
SIDOR Andrzej Sławomir
27
0.80
0.09
22
DĘBSKA Beata Teresa
25
0.74
0.08
23
KOWALCZYK-DWORZYŃSKA Malwina
20
0.59
0.07
24
PRZYBYŁOWICZ Roman Józef
3
0.08
0.01
25
SAWICKI Andrzej Dariusz
51
1.51
0.17
26
DURKA Andrzej Zdzisław
68
2.01
0.23
Σ
3370
100.00
11.33
.
.
Voting Results by location of ward electoral commission.
.
.
.
.
.
.
.
.
.
.
.
.
.
.
.
.
.
No.
Name
No. of entitled
to vote
No. of ballot
papers issued
No. of votes
No. of votes: per list / valid [%]
total
valid
per List
1
City
36856
20363
20343
19959
1818
9.11
2
Country
26709
10058
10057
9764
1552
15.90
.
Voting Results by number of inhabitants of commune
.
1
to 5 000
5956
2370
2370
2296
351
15.29
2
from 5 001 to 10 000
10350
4046
4046
3934
457
11.62
3
from 10 001 to 20 000
0
0
0
0
0
0.00
4
from 20 001 to 50 000
47259
24005
23984
23493
2562
10.91
5
from 50 001 to 100 000
0
0
0
0
0
0.00
6
from 100 001 to 200 000
0
0
0
0
0
0.00
7
from 200 001 to 500 000
0
0
0
0
0
0.00
8
over 500 000
0
0
0
0
0
0.00
Legal Acts
Documents
Electoral Bodies
Election Committees and Candidates
Turnout
Results
Statistical Data
SENATE
Created by
Copyright © 2007
Mikrobit Sp. z o.o.
. All Rights Reserved.
top