.
.
Legal Acts
Documents
Electoral Bodies
Election Committees and Candidates
Turnout
Results
Statistical Data
SENATE
Created by
.
.
Voting Results
.
.
.
Voting Results for Committee
.
.
.
.
.
.
.
.
.
.
.
.
.
.
.
.
.
.
.
.
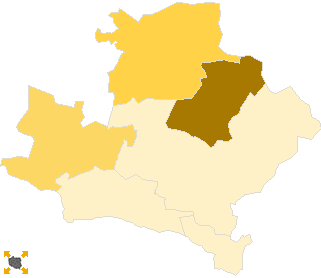
Polska
/
Kalisz
/
krotoszyński, pow.
...
Komitet Wyborczy Polskiego Stronnictwa Ludowego
List's Number:
10
No. of valid votes:
29573
No. of votes per List:
4883
16.51%
lack
11.54%
13.79%
16.04%
18.29%
20.54%
22.79%
25.04%
27.29%
29.54%
31.79%
not
of data
13.78%
16.03%
18.28%
20.53%
22.78%
25.03%
27.28%
29.53%
31.78%
34.04%
applicable
See also:
Turnout
Votes per Lists
Votes per Candidates
Information about Election Committee
Election results
Voting Results by location of ward electoral commission
.
.
Voting Results for Committee.
.
.
.
.
.
.
.
.
.
.
.
.
.
.
.
.
.
No.
Name
No. of entitled
to vote
No. of ballot papers
issued
No. of votes
No. of votes: per list / valid [%]
total
valid
per List
301202
Kobylin, gm.
6274
2878
2876
2744
579
21.10
301203
Koźmin Wielkopolski, gm.
10748
5254
5252
5011
1188
23.71
301204
Krotoszyn, gm.
31783
16876
16821
16424
2089
12.72
301205
Rozdrażew, gm.
3890
1815
1810
1744
592
33.94
301201
Sulmierzyce, m.
2133
1063
1063
1022
118
11.55
301206
Zduny, gm.
5436
2735
2731
2628
317
12.06
krotoszyński, pow.
60264
30621
30553
29573
4883
16.51
.
.
Voting Results for Candidates
.
.
.
.
.
.
.
.
.
.
.
.
.
.
.
No.
Surname Names
No. of votes
% No. of votes per candidate/No. per list
% No. of votes per candidate/No. of valid votes
1
GRZYB Andrzej Marian
929
19.02
3.14
2
RACKI Józef
47
0.96
0.16
3
MAĆKOWIAK Zdzisław
208
4.25
0.70
4
WALKOWSKI Piotr
120
2.45
0.41
5
KŁOS Marian Tadeusz
43
0.88
0.15
6
GÓRCZYŃSKA Maria Jolanta
72
1.47
0.24
7
WĄSIEWSKI Sławomir
46
0.94
0.16
8
MARSZAŁEK Franciszek
2171
44.46
7.34
9
BRZESKOT Grzegorz Józef
23
0.47
0.08
10
KARALUS Michał Roman
71
1.45
0.24
11
BALCER Michał Wawrzyniec
28
0.57
0.09
12
KONIECZNY Bogdan Jan
46
0.94
0.16
13
STARZYŃSKA-BIAŁEK Gabriela Anna
49
1.00
0.17
14
ŁUCZAK Mieczysław
24
0.49
0.08
15
SITEK Bożena Waleria
31
0.63
0.10
16
ZIELNICA Genowefa Janina
13
0.26
0.04
17
SZYSZKA Sławomir
765
15.66
2.59
18
RATAJCZAK Grzegorz
73
1.49
0.25
19
JANKOWSKI Andrzej Błażej
24
0.49
0.08
20
DOMANIECKI Waldemar
9
0.18
0.03
21
WOJCIAK Stanisław
5
0.10
0.02
22
NOWICKI Krzysztof Walenty
16
0.32
0.05
23
FLORCZYK Wojciech Zdzisław
11
0.22
0.04
24
NOWAK Marek Tadeusz
59
1.20
0.20
Σ
4883
100.00
16.51
.
.
Voting Results by location of ward electoral commission.
.
.
.
.
.
.
.
.
.
.
.
.
.
.
.
.
.
No.
Name
No. of entitled
to vote
No. of ballot
papers issued
No. of votes
No. of votes: per list / valid [%]
total
valid
per List
1
City
36999
20212
20153
19569
1397
7.14
2
Country
23265
10409
10400
10004
3486
34.85
.
Voting Results by number of inhabitants of commune
.
1
to 5 000
2133
1063
1063
1022
118
11.55
2
from 5 001 to 10 000
15600
7428
7417
7116
1488
20.91
3
from 10 001 to 20 000
10748
5254
5252
5011
1188
23.71
4
from 20 001 to 50 000
31783
16876
16821
16424
2089
12.72
5
from 50 001 to 100 000
0
0
0
0
0
0.00
6
from 100 001 to 200 000
0
0
0
0
0
0.00
7
from 200 001 to 500 000
0
0
0
0
0
0.00
8
over 500 000
0
0
0
0
0
0.00
Legal Acts
Documents
Electoral Bodies
Election Committees and Candidates
Turnout
Results
Statistical Data
SENATE
Created by
Copyright © 2007
Mikrobit Sp. z o.o.
. All Rights Reserved.
top