.
.
Legal Acts
Documents
Electoral Bodies
Election Committees and Candidates
Turnout
Results
Statistical Data
SENATE
Created by
.
.
Voting Results
.
.
.
Voting Results for Committee
.
.
.
.
.
.
.
.
.
.
.
.
.
.
.
.
.
.
.
.
Polska
/
Kalisz
/
kościański, pow.
...
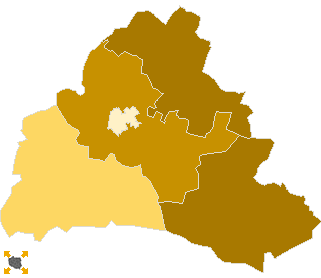
Komitet Wyborczy Polskiego Stronnictwa Ludowego
List's Number:
10
No. of valid votes:
30127
No. of votes per List:
3742
12.42%
lack
4.28%
5.94%
7.60%
9.26%
10.92%
12.58%
14.24%
15.90%
17.56%
19.22%
not
of data
5.93%
7.59%
9.25%
10.91%
12.57%
14.23%
15.89%
17.55%
19.21%
20.88%
applicable
See also:
Turnout
Votes per Lists
Votes per Candidates
Information about Election Committee
Election results
Voting Results by location of ward electoral commission
.
.
Voting Results for Committee.
.
.
.
.
.
.
.
.
.
.
.
.
.
.
.
.
.
No.
Name
No. of entitled
to vote
No. of ballot papers
issued
No. of votes
No. of votes: per list / valid [%]
total
valid
per List
301102
Czempiń, gm.
8807
4387
4386
4172
871
20.88
301103
Kościan, gm.
11606
5680
5674
5423
1025
18.90
301101
Kościan, m.
19534
11443
11423
11155
478
4.29
301104
Krzywiń, gm.
7607
3479
3476
3306
669
20.24
301105
Śmigiel, gm.
13646
6344
6343
6071
699
11.51
kościański, pow.
61200
31333
31302
30127
3742
12.42
.
.
Voting Results for Candidates
.
.
.
.
.
.
.
.
.
.
.
.
.
.
.
No.
Surname Names
No. of votes
% No. of votes per candidate/No. per list
% No. of votes per candidate/No. of valid votes
1
GRZYB Andrzej Marian
749
20.01
2.49
2
RACKI Józef
70
1.87
0.23
3
MAĆKOWIAK Zdzisław
278
7.42
0.92
4
WALKOWSKI Piotr
104
2.77
0.35
5
KŁOS Marian Tadeusz
846
22.60
2.81
6
GÓRCZYŃSKA Maria Jolanta
120
3.20
0.40
7
WĄSIEWSKI Sławomir
28
0.74
0.09
8
MARSZAŁEK Franciszek
62
1.65
0.21
9
BRZESKOT Grzegorz Józef
34
0.90
0.11
10
KARALUS Michał Roman
49
1.30
0.16
11
BALCER Michał Wawrzyniec
35
0.93
0.12
12
KONIECZNY Bogdan Jan
55
1.46
0.18
13
STARZYŃSKA-BIAŁEK Gabriela Anna
40
1.06
0.13
14
ŁUCZAK Mieczysław
26
0.69
0.09
15
SITEK Bożena Waleria
30
0.80
0.10
16
ZIELNICA Genowefa Janina
28
0.74
0.09
17
SZYSZKA Sławomir
29
0.77
0.10
18
RATAJCZAK Grzegorz
995
26.59
3.30
19
JANKOWSKI Andrzej Błażej
21
0.56
0.07
20
DOMANIECKI Waldemar
17
0.45
0.06
21
WOJCIAK Stanisław
16
0.42
0.05
22
NOWICKI Krzysztof Walenty
22
0.58
0.07
23
FLORCZYK Wojciech Zdzisław
14
0.37
0.05
24
NOWAK Marek Tadeusz
74
1.97
0.25
Σ
3742
100.00
12.42
.
.
Voting Results by location of ward electoral commission.
.
.
.
.
.
.
.
.
.
.
.
.
.
.
.
.
.
No.
Name
No. of entitled
to vote
No. of ballot
papers issued
No. of votes
No. of votes: per list / valid [%]
total
valid
per List
1
City
31087
17601
17578
17044
1224
7.18
2
Country
30113
13732
13724
13083
2518
19.25
.
Voting Results by number of inhabitants of commune
.
1
to 5 000
0
0
0
0
0
0.00
2
from 5 001 to 10 000
7607
3479
3476
3306
669
20.24
3
from 10 001 to 20 000
34059
16411
16403
15666
2595
16.56
4
from 20 001 to 50 000
19534
11443
11423
11155
478
4.29
5
from 50 001 to 100 000
0
0
0
0
0
0.00
6
from 100 001 to 200 000
0
0
0
0
0
0.00
7
from 200 001 to 500 000
0
0
0
0
0
0.00
8
over 500 000
0
0
0
0
0
0.00
Legal Acts
Documents
Electoral Bodies
Election Committees and Candidates
Turnout
Results
Statistical Data
SENATE
Created by
Copyright © 2007
Mikrobit Sp. z o.o.
. All Rights Reserved.
top