.
.
Legal Acts
Documents
Electoral Bodies
Election Committees and Candidates
Turnout
Results
Statistical Data
SENATE
Created by
.
.
Voting Results
.
.
.
Voting Results for Committee
.
.
.
.
.
.
.
.
.
.
.
.
.
.
.
.
.
.
.
.
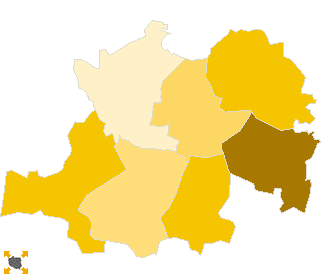
Polska
/
Kalisz
/
gostyński, pow.
...
Komitet Wyborczy Polskiego Stronnictwa Ludowego
List's Number:
10
No. of valid votes:
26502
No. of votes per List:
3873
14.61%
lack
6.56%
9.11%
11.66%
14.21%
16.76%
19.31%
21.86%
24.41%
26.96%
29.51%
not
of data
9.10%
11.65%
14.20%
16.75%
19.30%
21.85%
24.40%
26.95%
29.50%
32.06%
applicable
See also:
Turnout
Votes per Lists
Votes per Candidates
Information about Election Committee
Election results
Voting Results by location of ward electoral commission
.
.
Voting Results for Committee.
.
.
.
.
.
.
.
.
.
.
.
.
.
.
.
.
.
No.
Name
No. of entitled
to vote
No. of ballot papers
issued
No. of votes
No. of votes: per list / valid [%]
total
valid
per List
300401
Borek Wielkopolski, gm.
5964
2438
2438
2312
525
22.71
300402
Gostyń, gm.
22088
11638
11600
11309
742
6.56
300403
Krobia, gm.
9985
4274
4273
4127
605
14.66
300404
Pępowo, gm.
4595
2113
2112
2024
461
22.78
300405
Piaski, gm.
6486
2896
2895
2788
468
16.79
300406
Pogorzela, gm.
3907
1648
1647
1582
507
32.05
300407
Poniec, gm.
6193
2496
2491
2360
565
23.94
gostyński, pow.
59218
27503
27456
26502
3873
14.61
.
.
Voting Results for Candidates
.
.
.
.
.
.
.
.
.
.
.
.
.
.
.
No.
Surname Names
No. of votes
% No. of votes per candidate/No. per list
% No. of votes per candidate/No. of valid votes
1
GRZYB Andrzej Marian
981
25.32
3.70
2
RACKI Józef
56
1.44
0.21
3
MAĆKOWIAK Zdzisław
484
12.49
1.83
4
WALKOWSKI Piotr
52
1.34
0.20
5
KŁOS Marian Tadeusz
72
1.85
0.27
6
GÓRCZYŃSKA Maria Jolanta
110
2.84
0.42
7
WĄSIEWSKI Sławomir
25
0.64
0.09
8
MARSZAŁEK Franciszek
193
4.98
0.73
9
BRZESKOT Grzegorz Józef
97
2.50
0.37
10
KARALUS Michał Roman
62
1.60
0.23
11
BALCER Michał Wawrzyniec
44
1.13
0.17
12
KONIECZNY Bogdan Jan
319
8.23
1.20
13
STARZYŃSKA-BIAŁEK Gabriela Anna
47
1.21
0.18
14
ŁUCZAK Mieczysław
51
1.31
0.19
15
SITEK Bożena Waleria
24
0.61
0.09
16
ZIELNICA Genowefa Janina
28
0.72
0.11
17
SZYSZKA Sławomir
50
1.29
0.19
18
RATAJCZAK Grzegorz
53
1.36
0.20
19
JANKOWSKI Andrzej Błażej
40
1.03
0.15
20
DOMANIECKI Waldemar
51
1.31
0.19
21
WOJCIAK Stanisław
23
0.59
0.09
22
NOWICKI Krzysztof Walenty
891
23.00
3.36
23
FLORCZYK Wojciech Zdzisław
41
1.05
0.15
24
NOWAK Marek Tadeusz
79
2.03
0.30
Σ
3873
100.00
14.61
.
.
Voting Results by location of ward electoral commission.
.
.
.
.
.
.
.
.
.
.
.
.
.
.
.
.
.
No.
Name
No. of entitled
to vote
No. of ballot
papers issued
No. of votes
No. of votes: per list / valid [%]
total
valid
per List
1
City
25600
13968
13955
13576
927
6.83
2
Country
33618
13535
13501
12926
2946
22.79
.
Voting Results by number of inhabitants of commune
.
1
to 5 000
0
0
0
0
0
0.00
2
from 5 001 to 10 000
27145
11591
11583
11066
2526
22.83
3
from 10 001 to 20 000
9985
4274
4273
4127
605
14.66
4
from 20 001 to 50 000
22088
11638
11600
11309
742
6.56
5
from 50 001 to 100 000
0
0
0
0
0
0.00
6
from 100 001 to 200 000
0
0
0
0
0
0.00
7
from 200 001 to 500 000
0
0
0
0
0
0.00
8
over 500 000
0
0
0
0
0
0.00
Legal Acts
Documents
Electoral Bodies
Election Committees and Candidates
Turnout
Results
Statistical Data
SENATE
Created by
Copyright © 2007
Mikrobit Sp. z o.o.
. All Rights Reserved.
top