|
See also:
|
| . |
. |
Voting Results for Committee. |
. |
. |
| . |
. |
| . |
. |
. |
. |
. |
. |
. |
. |
. |
. |
. |
. |
. |
| No. |
Name |
No. of entitled
to vote |
No. of ballot papers
issued |
No. of votes |
No. of votes: per list / valid [%] |
| total |
valid |
per List |
| 240304 | Brenna, gm. | 8060 | 4254 | 4253 | 4144 | 436 | 10.52 |  |
| 240305 | Chybie, gm. | 7130 | 3747 | 3747 | 3677 | 216 | 5.87 | |
| 240301 | Cieszyn, m. | 29418 | 17944 | 17930 | 17576 | 985 | 5.60 | |
| 240306 | Dębowiec, gm. | 4239 | 2324 | 2324 | 2283 | 177 | 7.75 | |
| 240307 | Goleszów, gm. | 9883 | 5668 | 5668 | 5576 | 486 | 8.72 | |
| 240308 | Hażlach, gm. | 7506 | 4027 | 4027 | 3947 | 370 | 9.37 | |
| 240309 | Istebna, gm. | 8566 | 4641 | 4639 | 4485 | 357 | 7.96 | |
| 240310 | Skoczów, gm. | 20226 | 11177 | 11157 | 10871 | 496 | 4.56 | |
| 240311 | Strumień, gm. | 9400 | 5182 | 5179 | 5055 | 418 | 8.27 | |
| 240302 | Ustroń, m. | 13672 | 8638 | 8634 | 8442 | 475 | 5.63 | |
| 240303 | Wisła, m. | 9323 | 5343 | 5343 | 5276 | 702 | 13.31 | |
| 240312 | Zebrzydowice, gm. | 9797 | 5611 | 5606 | 5513 | 393 | 7.13 | |
| |
cieszyński, pow. |
137220 |
78556 |
78507 |
76845 |
5511 |
7.17 |
 |
|
| |
| . |
. |
Voting Results by location of ward electoral commission. |
. |
. |
| . |
. |
| . |
. |
. |
. |
. |
. |
. |
. |
. |
. |
. |
. |
. |
| No. |
Name |
No. of entitled
to vote |
No. of ballot
papers issued |
No. of votes |
No. of votes: per list / valid [%] |
| total |
valid |
per List |
| 1 | City | 66913 | 40141 | 40117 | 39305 | 2516 | 6.40 | |
| 2 | Country | 70307 | 38415 | 38390 | 37540 | 2995 | 7.98 | |
| . |
Voting Results by number of inhabitants of commune |
. |
| 1 | to 5 000 | 0 | 0 | 0 | 0 | 0 | 0.00 | |
| 2 | from 5 001 to 10 000 | 18875 | 10098 | 10098 | 9907 | 763 | 7.70 | |
| 3 | from 10 001 to 20 000 | 68701 | 39337 | 39322 | 38491 | 3267 | 8.49 | |
| 4 | from 20 001 to 50 000 | 49644 | 29121 | 29087 | 28447 | 1481 | 5.21 | |
| 5 | from 50 001 to 100 000 | 0 | 0 | 0 | 0 | 0 | 0.00 | |
| 6 | from 100 001 to 200 000 | 0 | 0 | 0 | 0 | 0 | 0.00 | |
| 7 | from 200 001 to 500 000 | 0 | 0 | 0 | 0 | 0 | 0.00 | |
| 8 | over 500 000 | 0 | 0 | 0 | 0 | 0 | 0.00 | |
|
|


 Legal Acts
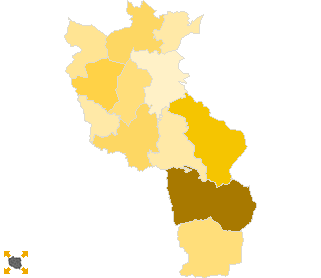
 Legal Acts