.
.
Legal Acts
Documents
Electoral Bodies
Election Committees and Candidates
Turnout
Results
Statistical Data
SENATE
Created by
.
.
Voting Results
.
.
.
Voting Results for Committee
.
.
.
.
.
.
.
.
.
.
.
.
.
.
.
.
.
.
.
.
Polska
/
Gdynia
/
kościerski, pow.
...
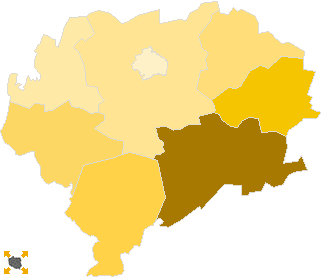
Komitet Wyborczy Polskiego Stronnictwa Ludowego
List's Number:
10
No. of valid votes:
26745
No. of votes per List:
1764
6.60%
lack
2.14%
3.79%
5.44%
7.09%
8.74%
10.39%
12.04%
13.69%
15.34%
16.99%
not
of data
3.78%
5.43%
7.08%
8.73%
10.38%
12.03%
13.68%
15.33%
16.98%
18.64%
applicable
See also:
Turnout
Votes per Lists
Votes per Candidates
Information about Election Committee
Election results
Voting Results by location of ward electoral commission
.
.
Voting Results for Committee.
.
.
.
.
.
.
.
.
.
.
.
.
.
.
.
.
.
No.
Name
No. of entitled
to vote
No. of ballot papers
issued
No. of votes
No. of votes: per list / valid [%]
total
valid
per List
220602
Dziemiany, gm.
3065
1640
1639
1586
139
8.76
220603
Karsin, gm.
4439
2448
2446
2338
264
11.29
220604
Kościerzyna, gm.
10203
5347
5329
5159
299
5.80
220601
Kościerzyna, m.
18282
10493
10485
10238
220
2.15
220605
Liniewo, gm.
3542
1775
1775
1726
210
12.17
220606
Lipusz, gm.
2516
1421
1421
1386
67
4.83
220607
Nowa Karczma, gm.
4681
2178
2178
2118
157
7.41
220608
Stara Kiszewa, gm.
4904
2261
2261
2194
408
18.60
kościerski, pow.
51632
27563
27534
26745
1764
6.60
.
.
Voting Results for Candidates
.
.
.
.
.
.
.
.
.
.
.
.
.
.
.
No.
Surname Names
No. of votes
% No. of votes per candidate/No. per list
% No. of votes per candidate/No. of valid votes
1
BUJANOWICZ Stanisława Helena
313
17.74
1.17
2
SŁAWSKI Krzysztof Adam
142
8.04
0.53
3
KALINOWSKI Stanisław Bernard
271
15.36
1.01
4
BISTRAM Zenon Antoni
60
3.40
0.22
5
BOROWSKI Tomasz
56
3.17
0.21
6
BATRUCH Mirosław
18
1.02
0.07
7
GRABOWSKI Grzegorz Andrzej
144
8.16
0.54
8
MARCINIAK Adam Jan
23
1.30
0.09
9
GNIAZDOWSKA Elżbieta
43
2.43
0.16
10
PRUSZAK Krzysztof Ludwik
11
0.62
0.04
11
CZYŻ Kazimierz
18
1.02
0.07
12
LEWNA Hubert Alfons
75
4.25
0.28
13
CHLEBOWICZ Jerzy Jan
13
0.73
0.05
14
SZATKOWSKI Radosław Jan
14
0.79
0.05
15
JABŁOŃSKI Artur Jacek
70
3.96
0.26
16
KONCZANIN Bogusława
25
1.41
0.09
17
KURECKI Bogdan Jan
339
19.21
1.27
18
LEGUTKO Tadeusz Henryk
14
0.79
0.05
19
KALINOWSKI Marek
38
2.15
0.14
20
GONERA Paweł Marceli
11
0.62
0.04
21
WÓJCIK Ryszard
12
0.68
0.04
22
TOBIAS Rafał Roman
5
0.28
0.02
23
KELIŃSKI Tadeusz
5
0.28
0.02
24
GRECZKO Ludwik
2
0.11
0.01
25
KĘDRA Krzysztof
1
0.05
0.00
26
JANUSZEWSKI Józef
8
0.45
0.03
27
ZAWADZKI Leszek Andrzej
5
0.28
0.02
28
DĄBROWA Grzegorz Przemysław
28
1.58
0.10
Σ
1764
100.00
6.59
.
.
Voting Results by location of ward electoral commission.
.
.
.
.
.
.
.
.
.
.
.
.
.
.
.
.
.
No.
Name
No. of entitled
to vote
No. of ballot
papers issued
No. of votes
No. of votes: per list / valid [%]
total
valid
per List
1
City
18282
10493
10485
10238
220
2.15
2
Country
33350
17070
17049
16507
1544
9.35
.
Voting Results by number of inhabitants of commune
.
1
to 5 000
9123
4836
4835
4698
416
8.85
2
from 5 001 to 10 000
14024
6887
6885
6650
829
12.47
3
from 10 001 to 20 000
10203
5347
5329
5159
299
5.80
4
from 20 001 to 50 000
18282
10493
10485
10238
220
2.15
5
from 50 001 to 100 000
0
0
0
0
0
0.00
6
from 100 001 to 200 000
0
0
0
0
0
0.00
7
from 200 001 to 500 000
0
0
0
0
0
0.00
8
over 500 000
0
0
0
0
0
0.00
Legal Acts
Documents
Electoral Bodies
Election Committees and Candidates
Turnout
Results
Statistical Data
SENATE
Created by
Copyright © 2007
Mikrobit Sp. z o.o.
. All Rights Reserved.
top