.
.
Legal Acts
Documents
Electoral Bodies
Election Committees and Candidates
Turnout
Results
Statistical Data
SENATE
Created by
.
.
Voting Results
.
.
.
Voting Results for Committee
.
.
.
.
.
.
.
.
.
.
.
.
.
.
.
.
.
.
.
.
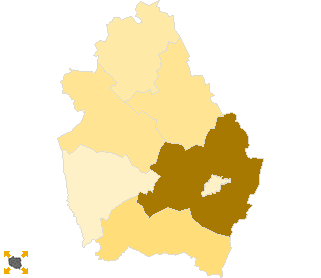
Polska
/
Gdynia
/
człuchowski, pow.
...
Komitet Wyborczy Polskiego Stronnictwa Ludowego
List's Number:
10
No. of valid votes:
21002
No. of votes per List:
2322
11.06%
lack
4.77%
7.24%
9.71%
12.18%
14.65%
17.12%
19.59%
22.06%
24.53%
27.00%
not
of data
7.23%
9.70%
12.17%
14.64%
17.11%
19.58%
22.05%
24.52%
26.99%
29.47%
applicable
See also:
Turnout
Votes per Lists
Votes per Candidates
Information about Election Committee
Election results
Voting Results by location of ward electoral commission
.
.
Voting Results for Committee.
.
.
.
.
.
.
.
.
.
.
.
.
.
.
.
.
.
No.
Name
No. of entitled
to vote
No. of ballot papers
issued
No. of votes
No. of votes: per list / valid [%]
total
valid
per List
220302
Czarne, gm.
8841
4476
4476
4292
205
4.78
220303
Człuchów, gm.
7595
3072
3070
2962
871
29.41
220301
Człuchów, m.
11932
6592
6592
6392
388
6.07
220304
Debrzno, gm.
7177
2964
2964
2837
392
13.82
220305
Koczała, gm.
2860
1322
1322
1242
120
9.66
220306
Przechlewo, gm.
4791
2280
2279
2183
226
10.35
220307
Rzeczenica, gm.
2937
1153
1153
1094
120
10.97
człuchowski, pow.
46133
21859
21856
21002
2322
11.06
.
.
Voting Results for Candidates
.
.
.
.
.
.
.
.
.
.
.
.
.
.
.
No.
Surname Names
No. of votes
% No. of votes per candidate/No. per list
% No. of votes per candidate/No. of valid votes
1
BUJANOWICZ Stanisława Helena
154
6.63
0.73
2
SŁAWSKI Krzysztof Adam
77
3.31
0.37
3
KALINOWSKI Stanisław Bernard
169
7.27
0.80
4
BISTRAM Zenon Antoni
27
1.16
0.13
5
BOROWSKI Tomasz
37
1.59
0.18
6
BATRUCH Mirosław
73
3.14
0.35
7
GRABOWSKI Grzegorz Andrzej
32
1.37
0.15
8
MARCINIAK Adam Jan
912
39.27
4.34
9
GNIAZDOWSKA Elżbieta
86
3.70
0.41
10
PRUSZAK Krzysztof Ludwik
26
1.11
0.12
11
CZYŻ Kazimierz
16
0.68
0.08
12
LEWNA Hubert Alfons
3
0.12
0.01
13
CHLEBOWICZ Jerzy Jan
62
2.67
0.30
14
SZATKOWSKI Radosław Jan
14
0.60
0.07
15
JABŁOŃSKI Artur Jacek
30
1.29
0.14
16
KONCZANIN Bogusława
117
5.03
0.56
17
KURECKI Bogdan Jan
8
0.34
0.04
18
LEGUTKO Tadeusz Henryk
11
0.47
0.05
19
KALINOWSKI Marek
69
2.97
0.33
20
GONERA Paweł Marceli
15
0.64
0.07
21
WÓJCIK Ryszard
217
9.34
1.03
22
TOBIAS Rafał Roman
2
0.08
0.01
23
KELIŃSKI Tadeusz
6
0.25
0.03
24
GRECZKO Ludwik
2
0.08
0.01
25
KĘDRA Krzysztof
129
5.55
0.61
26
JANUSZEWSKI Józef
3
0.12
0.01
27
ZAWADZKI Leszek Andrzej
7
0.30
0.03
28
DĄBROWA Grzegorz Przemysław
18
0.77
0.09
Σ
2322
100.00
11.05
.
.
Voting Results by location of ward electoral commission.
.
.
.
.
.
.
.
.
.
.
.
.
.
.
.
.
.
No.
Name
No. of entitled
to vote
No. of ballot
papers issued
No. of votes
No. of votes: per list / valid [%]
total
valid
per List
1
City
22205
11989
11989
11609
703
6.06
2
Country
23928
9870
9867
9393
1619
17.24
.
Voting Results by number of inhabitants of commune
.
1
to 5 000
5797
2475
2475
2336
240
10.27
2
from 5 001 to 10 000
20809
9720
9719
9312
823
8.84
3
from 10 001 to 20 000
19527
9664
9662
9354
1259
13.46
4
from 20 001 to 50 000
0
0
0
0
0
0.00
5
from 50 001 to 100 000
0
0
0
0
0
0.00
6
from 100 001 to 200 000
0
0
0
0
0
0.00
7
from 200 001 to 500 000
0
0
0
0
0
0.00
8
over 500 000
0
0
0
0
0
0.00
Legal Acts
Documents
Electoral Bodies
Election Committees and Candidates
Turnout
Results
Statistical Data
SENATE
Created by
Copyright © 2007
Mikrobit Sp. z o.o.
. All Rights Reserved.
top