.
.
Legal Acts
Documents
Electoral Bodies
Election Committees and Candidates
Turnout
Results
Statistical Data
SENATE
Created by
.
.
Voting Results
.
.
.
Voting Results for Committee
.
.
.
.
.
.
.
.
.
.
.
.
.
.
.
.
.
.
.
.
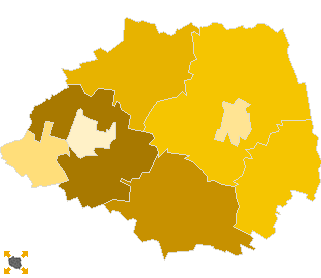
Polska
/
Białystok
/
bielski, pow.
...
Komitet Wyborczy Polskiego Stronnictwa Ludowego
List's Number:
10
No. of valid votes:
23639
No. of votes per List:
1192
5.04%
lack
2.35%
2.95%
3.55%
4.15%
4.75%
5.35%
5.95%
6.55%
7.15%
7.75%
not
of data
2.94%
3.54%
4.14%
4.74%
5.34%
5.94%
6.54%
7.14%
7.74%
8.35%
applicable
See also:
Turnout
Votes per Lists
Votes per Candidates
Information about Election Committee
Election results
Voting Results by location of ward electoral commission
.
.
Voting Results for Committee.
.
.
.
.
.
.
.
.
.
.
.
.
.
.
.
.
.
No.
Name
No. of entitled
to vote
No. of ballot papers
issued
No. of votes
No. of votes: per list / valid [%]
total
valid
per List
200303
Bielsk Podlaski, gm.
6367
2385
2384
2339
147
6.28
200301
Bielsk Podlaski, m.
21812
11322
11312
11127
404
3.63
200304
Boćki, gm.
4065
1711
1711
1658
121
7.30
200305
Brańsk, gm.
5131
2862
2860
2807
233
8.30
200302
Brańsk, m.
3113
1763
1763
1700
40
2.35
200306
Orla, gm.
2932
1160
1160
1114
71
6.37
200307
Rudka, gm.
1679
911
910
888
41
4.62
200308
Wyszki, gm.
4002
2042
2039
2006
135
6.73
bielski, pow.
49101
24156
24139
23639
1192
5.04
.
.
Voting Results for Candidates
.
.
.
.
.
.
.
.
.
.
.
.
.
.
.
No.
Surname Names
No. of votes
% No. of votes per candidate/No. per list
% No. of votes per candidate/No. of valid votes
1
KAMIŃSKI Jan
375
31.45
1.59
2
JANOWSKI Mikołaj
226
18.95
0.96
3
MIODUSZEWSKI Józef
19
1.59
0.08
4
MIRONOWICZ Antoni
105
8.80
0.44
5
GRUCHAŁA Leszek
12
1.00
0.05
6
BORAWSKI Edmund
21
1.76
0.09
7
BASZKO Mieczysław Kazimierz
8
0.67
0.03
8
ZALEWSKI Jan
65
5.45
0.27
9
SMOLAK Leszek Henryk
47
3.94
0.20
10
HOŁOWIENKO Dorota
31
2.60
0.13
11
BIELAWSKA Małgorzata
26
2.18
0.11
12
CHWIEŚKO Zenon Jan
4
0.33
0.02
13
DĄBROWSKI Zdzisław
14
1.17
0.06
14
DANISZEWSKI Andrzej Franciszek
5
0.41
0.02
15
DŁUGOZIMA Roland Andrzej
4
0.33
0.02
16
FIEDORCZYK Stanisław
4
0.33
0.02
17
GIERŁOWSKI Mieczysław
3
0.25
0.01
18
GORSKA Irena
14
1.17
0.06
19
KACZAN Jan
7
0.58
0.03
20
KACZYŃSKI Marek
32
2.68
0.14
21
KRAJEWSKI Stefan
5
0.41
0.02
22
KRAWCZENIUK Piotr
3
0.25
0.01
23
KRZYWICKI Andrzej Jan
3
0.25
0.01
24
MISZKIEL Józef
2
0.16
0.01
25
NIESTERUK Włodzimierz
31
2.60
0.13
26
ŚLEPOWROŃSKI Piotr
8
0.67
0.03
27
URBANOWICZ Mieczysław
4
0.33
0.02
28
WENDRZYCKI Wojciech
4
0.33
0.02
29
ŻYLIŃSKI Wiesław
9
0.75
0.04
30
ZALEWSKI Bolesław
101
8.47
0.43
Σ
1192
100.00
5.04
.
.
Voting Results by location of ward electoral commission.
.
.
.
.
.
.
.
.
.
.
.
.
.
.
.
.
.
No.
Name
No. of entitled
to vote
No. of ballot
papers issued
No. of votes
No. of votes: per list / valid [%]
total
valid
per List
1
City
24925
13085
13075
12827
444
3.46
2
Country
24176
11071
11064
10812
748
6.92
.
Voting Results by number of inhabitants of commune
.
1
to 5 000
7724
3834
3833
3702
152
4.11
2
from 5 001 to 10 000
19565
9000
8994
8810
636
7.22
3
from 10 001 to 20 000
0
0
0
0
0
0.00
4
from 20 001 to 50 000
21812
11322
11312
11127
404
3.63
5
from 50 001 to 100 000
0
0
0
0
0
0.00
6
from 100 001 to 200 000
0
0
0
0
0
0.00
7
from 200 001 to 500 000
0
0
0
0
0
0.00
8
over 500 000
0
0
0
0
0
0.00
Legal Acts
Documents
Electoral Bodies
Election Committees and Candidates
Turnout
Results
Statistical Data
SENATE
Created by
Copyright © 2007
Mikrobit Sp. z o.o.
. All Rights Reserved.
top