|
See also:
|
| . |
. |
Voting Results for Committee. |
. |
. |
| . |
. |
| . |
. |
. |
. |
. |
. |
. |
. |
. |
. |
. |
. |
. |
| No. |
Name |
No. of entitled
to vote |
No. of ballot papers
issued |
No. of votes |
No. of votes: per list / valid [%] |
| total |
valid |
per List |
| 181602 | Błażowa, gm. | 8337 | 4250 | 4248 | 4094 | 659 | 16.10 |  |
| 181603 | Boguchwała, gm. | 16712 | 9826 | 9825 | 9659 | 1049 | 10.86 | |
| 181604 | Chmielnik, gm. | 4879 | 2557 | 2555 | 2493 | 366 | 14.68 | |
| 181605 | Dynów, gm. | 5583 | 2219 | 2218 | 2129 | 350 | 16.44 | |
| 181601 | Dynów, m. | 4881 | 2430 | 2430 | 2367 | 171 | 7.22 | |
| 181606 | Głogów Małopolski, gm. | 14027 | 8042 | 8039 | 7885 | 1233 | 15.64 | |
| 181607 | Hyżne, gm. | 5225 | 2930 | 2930 | 2871 | 423 | 14.73 | |
| 181608 | Kamień, gm. | 5239 | 2582 | 2579 | 2512 | 333 | 13.26 | |
| 181609 | Krasne, gm. | 7540 | 4373 | 4372 | 4253 | 549 | 12.91 | |
| 181610 | Lubenia, gm. | 5102 | 2618 | 2616 | 2511 | 241 | 9.60 | |
| 181611 | Sokołów Małopolski, gm. | 12596 | 6660 | 6638 | 6497 | 374 | 5.76 | |
| 181612 | Świlcza, gm. | 12978 | 7215 | 7213 | 7054 | 929 | 13.17 | |
| 181613 | Trzebownisko, gm. | 14302 | 8191 | 8188 | 8029 | 768 | 9.57 | |
| 181614 | Tyczyn, gm. | 12388 | 6952 | 6946 | 6819 | 761 | 11.16 | |
| |
rzeszowski, pow. |
129789 |
70845 |
70797 |
69173 |
8206 |
11.86 |
 |
|
| |
| . |
. |
Voting Results by location of ward electoral commission. |
. |
. |
| . |
. |
| . |
. |
. |
. |
. |
. |
. |
. |
. |
. |
. |
. |
. |
| No. |
Name |
No. of entitled
to vote |
No. of ballot
papers issued |
No. of votes |
No. of votes: per list / valid [%] |
| total |
valid |
per List |
| 1 | City | 16330 | 9009 | 9000 | 8814 | 794 | 9.01 | |
| 2 | Country | 113459 | 61836 | 61797 | 60359 | 7412 | 12.28 | |
| . |
Voting Results by number of inhabitants of commune |
. |
| 1 | to 5 000 | 0 | 0 | 0 | 0 | 0 | 0.00 | |
| 2 | from 5 001 to 10 000 | 38449 | 19709 | 19700 | 19136 | 2433 | 12.71 | |
| 3 | from 10 001 to 20 000 | 74628 | 41310 | 41272 | 40378 | 4724 | 11.70 | |
| 4 | from 20 001 to 50 000 | 16712 | 9826 | 9825 | 9659 | 1049 | 10.86 | |
| 5 | from 50 001 to 100 000 | 0 | 0 | 0 | 0 | 0 | 0.00 | |
| 6 | from 100 001 to 200 000 | 0 | 0 | 0 | 0 | 0 | 0.00 | |
| 7 | from 200 001 to 500 000 | 0 | 0 | 0 | 0 | 0 | 0.00 | |
| 8 | over 500 000 | 0 | 0 | 0 | 0 | 0 | 0.00 | |
|
|


 Legal Acts
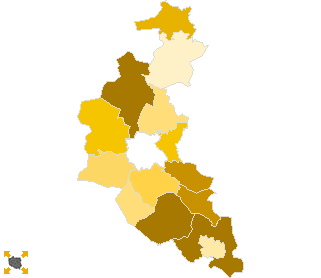
 Legal Acts