.
.
Legal Acts
Documents
Electoral Bodies
Election Committees and Candidates
Turnout
Results
Statistical Data
SENATE
Created by
.
.
Voting Results
.
.
.
Voting Results for Committee
.
.
.
.
.
.
.
.
.
.
.
.
.
.
.
.
.
.
.
.
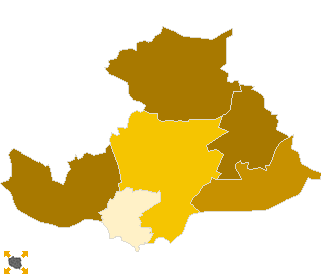
Polska
/
Lublin
/
rycki, pow.
...
Komitet Wyborczy Polskiego Stronnictwa Ludowego
List's Number:
10
No. of valid votes:
23872
No. of votes per List:
4888
20.48%
lack
8.55%
10.72%
12.89%
15.06%
17.23%
19.40%
21.57%
23.74%
25.91%
28.08%
not
of data
10.71%
12.88%
15.05%
17.22%
19.39%
21.56%
23.73%
25.90%
28.07%
30.25%
applicable
See also:
Turnout
Votes per Lists
Votes per Candidates
Information about Election Committee
Election results
Voting Results by location of ward electoral commission
.
.
Voting Results for Committee.
.
.
.
.
.
.
.
.
.
.
.
.
.
.
.
.
.
No.
Name
No. of entitled
to vote
No. of ballot papers
issued
No. of votes
No. of votes: per list / valid [%]
total
valid
per List
061601
Dęblin, m.
14423
7772
7772
7586
649
8.56
061602
Kłoczew, gm.
5892
2781
2781
2686
779
29.00
061603
Nowodwór, gm.
3287
1519
1519
1492
450
30.16
061604
Ryki, gm.
16914
8749
8741
8584
1990
23.18
061605
Stężyca, gm.
4494
2203
2194
2141
645
30.13
061606
Ułęż, gm.
2930
1433
1433
1383
375
27.11
rycki, pow.
47940
24457
24440
23872
4888
20.48
.
.
Voting Results for Candidates
.
.
.
.
.
.
.
.
.
.
.
.
.
.
.
No.
Surname Names
No. of votes
% No. of votes per candidate/No. per list
% No. of votes per candidate/No. of valid votes
1
WOJTAS Edward
238
4.86
1.00
2
ŁOPATA Jan
52
1.06
0.22
3
STAROWNIK Marian Roman
25
0.51
0.10
4
SMOLARZ Henryk Józef
21
0.42
0.09
5
RODZIK Zenon Jerzy
14
0.28
0.06
6
ŚWIĘTOCHOWSKI Leszek Jan
12
0.24
0.05
7
GRZĘDA Mirosław Józef
39
0.79
0.16
8
BISEWSKA SAMSON Hanna Katarzyna
12
0.24
0.05
9
BORZĘCKA Hanna Irena
25
0.51
0.10
10
BUJAK Tomasz Marek
16
0.32
0.07
11
CHOLEWA Michał Tomasz
8
0.16
0.03
12
GOLEC Józef Franciszek
14
0.28
0.06
13
JABŁOŃSKA Maria Jolanta
29
0.59
0.12
14
JANKOWSKI Janusz
16
0.32
0.07
15
KAPUSTA Grzegorz Krzysztof
3013
61.64
12.62
16
KŁOPOTOWSKA Maria Halina
16
0.32
0.07
17
KOZARSKI Janusz Marek
4
0.08
0.02
18
KRAMEK Mirosław Adam
3
0.06
0.01
19
KWIECIEŃ Franciszek Marek
8
0.16
0.03
20
MICHALIK Marek Stanisław
1195
24.44
5.01
21
NIEDŹWIADEK Zdzisław Czesław
10
0.20
0.04
22
PIECAK Tomasz Piotr
14
0.28
0.06
23
PIECH Marek Antoni
8
0.16
0.03
24
PIEKARCZYK Jolanta Izabela
13
0.26
0.05
25
SOLARSKI Tadeusz
13
0.26
0.05
26
SPRYCHA Antoni Marian
15
0.30
0.06
27
WOJTAK Tadeusz Andrzej
8
0.16
0.03
28
WOŹNIAK Jan
17
0.34
0.07
29
ZIOBRONIEWICZ Wojciech Robert
5
0.10
0.02
30
ŻABA Marian Jan
25
0.51
0.10
Σ
4888
100.00
20.47
.
.
Voting Results by location of ward electoral commission.
.
.
.
.
.
.
.
.
.
.
.
.
.
.
.
.
.
No.
Name
No. of entitled
to vote
No. of ballot
papers issued
No. of votes
No. of votes: per list / valid [%]
total
valid
per List
1
City
22805
12490
12489
12230
1577
12.89
2
Country
25135
11967
11951
11642
3311
28.44
.
Voting Results by number of inhabitants of commune
.
1
to 5 000
6217
2952
2952
2875
825
28.70
2
from 5 001 to 10 000
10386
4984
4975
4827
1424
29.50
3
from 10 001 to 20 000
14423
7772
7772
7586
649
8.56
4
from 20 001 to 50 000
16914
8749
8741
8584
1990
23.18
5
from 50 001 to 100 000
0
0
0
0
0
0.00
6
from 100 001 to 200 000
0
0
0
0
0
0.00
7
from 200 001 to 500 000
0
0
0
0
0
0.00
8
over 500 000
0
0
0
0
0
0.00
Legal Acts
Documents
Electoral Bodies
Election Committees and Candidates
Turnout
Results
Statistical Data
SENATE
Created by
Copyright © 2007
Mikrobit Sp. z o.o.
. All Rights Reserved.
top