.
.
Legal Acts
Documents
Electoral Bodies
Election Committees and Candidates
Turnout
Results
Statistical Data
SENATE
Created by
.
.
Voting Results
.
.
.
Voting Results for Committee
.
.
.
.
.
.
.
.
.
.
.
.
.
.
.
.
.
.
.
.
Polska
/
Lublin
/
opolski, pow.
...
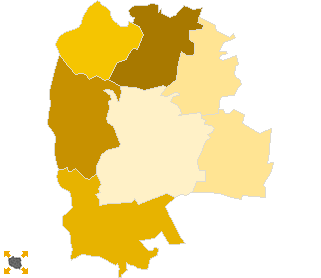
Komitet Wyborczy Polskiego Stronnictwa Ludowego
List's Number:
10
No. of valid votes:
21402
No. of votes per List:
4619
21.58%
lack
12.94%
15.31%
17.68%
20.05%
22.42%
24.79%
27.16%
29.53%
31.90%
34.27%
not
of data
15.30%
17.67%
20.04%
22.41%
24.78%
27.15%
29.52%
31.89%
34.26%
36.64%
applicable
See also:
Turnout
Votes per Lists
Votes per Candidates
Information about Election Committee
Election results
Voting Results by location of ward electoral commission
.
.
Voting Results for Committee.
.
.
.
.
.
.
.
.
.
.
.
.
.
.
.
.
.
No.
Name
No. of entitled
to vote
No. of ballot papers
issued
No. of votes
No. of votes: per list / valid [%]
total
valid
per List
061201
Chodel, gm.
5239
2258
2257
2181
433
19.85
061202
Józefów nad Wisłą, gm.
5756
2195
2195
2129
659
30.95
061203
Karczmiska, gm.
4828
1806
1806
1739
636
36.57
061204
Łaziska, gm.
4319
1733
1733
1682
572
34.01
061205
Opole Lubelskie, gm.
14460
6331
6328
6170
799
12.95
061206
Poniatowa, gm.
12547
5949
5945
5809
1042
17.94
061207
Wilków, gm.
3956
1758
1758
1692
478
28.25
opolski, pow.
51105
22030
22022
21402
4619
21.58
.
.
Voting Results for Candidates
.
.
.
.
.
.
.
.
.
.
.
.
.
.
.
No.
Surname Names
No. of votes
% No. of votes per candidate/No. per list
% No. of votes per candidate/No. of valid votes
1
WOJTAS Edward
491
10.63
2.29
2
ŁOPATA Jan
219
4.74
1.02
3
STAROWNIK Marian Roman
23
0.49
0.11
4
SMOLARZ Henryk Józef
91
1.97
0.43
5
RODZIK Zenon Jerzy
2926
63.34
13.67
6
ŚWIĘTOCHOWSKI Leszek Jan
13
0.28
0.06
7
GRZĘDA Mirosław Józef
31
0.67
0.14
8
BISEWSKA SAMSON Hanna Katarzyna
51
1.10
0.24
9
BORZĘCKA Hanna Irena
26
0.56
0.12
10
BUJAK Tomasz Marek
23
0.49
0.11
11
CHOLEWA Michał Tomasz
6
0.12
0.03
12
GOLEC Józef Franciszek
23
0.49
0.11
13
JABŁOŃSKA Maria Jolanta
57
1.23
0.27
14
JANKOWSKI Janusz
14
0.30
0.07
15
KAPUSTA Grzegorz Krzysztof
19
0.41
0.09
16
KŁOPOTOWSKA Maria Halina
19
0.41
0.09
17
KOZARSKI Janusz Marek
6
0.12
0.03
18
KRAMEK Mirosław Adam
358
7.75
1.67
19
KWIECIEŃ Franciszek Marek
13
0.28
0.06
20
MICHALIK Marek Stanisław
27
0.58
0.13
21
NIEDŹWIADEK Zdzisław Czesław
5
0.10
0.02
22
PIECAK Tomasz Piotr
12
0.25
0.06
23
PIECH Marek Antoni
16
0.34
0.07
24
PIEKARCZYK Jolanta Izabela
21
0.45
0.10
25
SOLARSKI Tadeusz
16
0.34
0.07
26
SPRYCHA Antoni Marian
5
0.10
0.02
27
WOJTAK Tadeusz Andrzej
16
0.34
0.07
28
WOŹNIAK Jan
57
1.23
0.27
29
ZIOBRONIEWICZ Wojciech Robert
5
0.10
0.02
30
ŻABA Marian Jan
30
0.64
0.14
Σ
4619
100.00
21.58
.
.
Voting Results by location of ward electoral commission.
.
.
.
.
.
.
.
.
.
.
.
.
.
.
.
.
.
No.
Name
No. of entitled
to vote
No. of ballot
papers issued
No. of votes
No. of votes: per list / valid [%]
total
valid
per List
1
City
12310
6139
6137
6020
714
11.86
2
Country
38795
15891
15885
15382
3905
25.39
.
Voting Results by number of inhabitants of commune
.
1
to 5 000
3956
1758
1758
1692
478
28.25
2
from 5 001 to 10 000
20142
7992
7991
7731
2300
29.75
3
from 10 001 to 20 000
27007
12280
12273
11979
1841
15.37
4
from 20 001 to 50 000
0
0
0
0
0
0.00
5
from 50 001 to 100 000
0
0
0
0
0
0.00
6
from 100 001 to 200 000
0
0
0
0
0
0.00
7
from 200 001 to 500 000
0
0
0
0
0
0.00
8
over 500 000
0
0
0
0
0
0.00
Legal Acts
Documents
Electoral Bodies
Election Committees and Candidates
Turnout
Results
Statistical Data
SENATE
Created by
Copyright © 2007
Mikrobit Sp. z o.o.
. All Rights Reserved.
top