.
.
Legal Acts
Documents
Electoral Bodies
Election Committees and Candidates
Turnout
Results
Statistical Data
SENATE
Created by
.
.
Voting Results
.
.
.
Voting Results for Committee
.
.
.
.
.
.
.
.
.
.
.
.
.
.
.
.
.
.
.
.
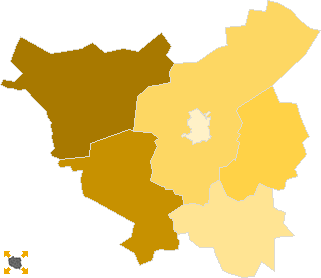
Polska
/
Toruń
/
golubsko-dobrzyński, pow.
...
Komitet Wyborczy Polskiego Stronnictwa Ludowego
List's Number:
10
No. of valid votes:
14235
No. of votes per List:
2462
17.30%
lack
4.83%
7.46%
10.09%
12.72%
15.35%
17.98%
20.61%
23.24%
25.87%
28.50%
not
of data
7.45%
10.08%
12.71%
15.34%
17.97%
20.60%
23.23%
25.86%
28.49%
31.13%
applicable
See also:
Turnout
Votes per Lists
Votes per Candidates
Information about Election Committee
Election results
Voting Results by location of ward electoral commission
.
.
Voting Results for Committee.
.
.
.
.
.
.
.
.
.
.
.
.
.
.
.
.
.
No.
Name
No. of entitled
to vote
No. of ballot papers
issued
No. of votes
No. of votes: per list / valid [%]
total
valid
per List
040502
Ciechocin, gm.
2945
1172
1172
1153
321
27.84
040503
Golub-Dobrzyń, gm.
6364
2407
2407
2318
385
16.61
040501
Golub-Dobrzyń, m.
10052
4820
4818
4694
227
4.84
040504
Kowalewo Pomorskie, gm.
8793
3864
3863
3744
1165
31.12
040505
Radomin, gm.
3194
1156
1156
1128
215
19.06
040506
Zbójno, gm.
3428
1232
1232
1198
149
12.44
golubsko-dobrzyński, pow.
34776
14651
14648
14235
2462
17.30
.
.
Voting Results for Candidates
.
.
.
.
.
.
.
.
.
.
.
.
.
.
.
No.
Surname Names
No. of votes
% No. of votes per candidate/No. per list
% No. of votes per candidate/No. of valid votes
1
KIERZKOWSKA Ewa Sławomira
201
8.16
1.41
2
SOSNOWSKI Zbigniew
206
8.36
1.45
3
BOBER Ryszard Jakub
93
3.77
0.65
4
SKRZYPEK Władysław Józef
32
1.29
0.22
5
GAPIŃSKI Henryk
15
0.60
0.11
6
GRABOWSKI Andrzej Antoni
1334
54.18
9.37
7
KORGOL Edmund Stanisław
3
0.12
0.02
8
GROSS Andrzej Ignacy
8
0.32
0.06
9
KOC Adam
16
0.64
0.11
10
ZAKRZEWSKI Tomasz
241
9.78
1.69
11
KRZYŻANOWSKA Teresa
31
1.25
0.22
12
PODYMA Józef Stanisław
7
0.28
0.05
13
GOŁĘBIEWSKI Roman
17
0.69
0.12
14
RÓG Leszek Władysław
18
0.73
0.13
15
CIEŚLA Andrzej
17
0.69
0.12
16
LEWANDOWSKA-MAZUREK Krystyna
27
1.09
0.19
17
MASIOTA Grzegorz Piotr
8
0.32
0.06
18
KULIŃSKI Wojciech Jerzy
4
0.16
0.03
19
KLONOWSKI Krzysztof Piotr
9
0.36
0.06
20
LEWANDOWSKI Marian
6
0.24
0.04
21
SKUPNIEWICZ Kazimierz
1
0.04
0.01
22
NAWROTEK Roman
6
0.24
0.04
23
WITCZAK Lucjan Kazimierz
2
0.08
0.01
24
KONRAD Sławomir Piotr
2
0.08
0.01
25
OŚMIAŁOWSKI Wiesław
6
0.24
0.04
26
KŁOPOTEK Andrzej
152
6.17
1.07
Σ
2462
100.00
17.29
.
.
Voting Results by location of ward electoral commission.
.
.
.
.
.
.
.
.
.
.
.
.
.
.
.
.
.
No.
Name
No. of entitled
to vote
No. of ballot
papers issued
No. of votes
No. of votes: per list / valid [%]
total
valid
per List
1
City
14151
6835
6833
6665
817
12.26
2
Country
20625
7816
7815
7570
1645
21.73
.
Voting Results by number of inhabitants of commune
.
1
to 5 000
9567
3560
3560
3479
685
19.69
2
from 5 001 to 10 000
6364
2407
2407
2318
385
16.61
3
from 10 001 to 20 000
18845
8684
8681
8438
1392
16.50
4
from 20 001 to 50 000
0
0
0
0
0
0.00
5
from 50 001 to 100 000
0
0
0
0
0
0.00
6
from 100 001 to 200 000
0
0
0
0
0
0.00
7
from 200 001 to 500 000
0
0
0
0
0
0.00
8
over 500 000
0
0
0
0
0
0.00
Legal Acts
Documents
Electoral Bodies
Election Committees and Candidates
Turnout
Results
Statistical Data
SENATE
Created by
Copyright © 2007
Mikrobit Sp. z o.o.
. All Rights Reserved.
top