.
.
Legal Acts
Documents
Electoral Bodies
Election Committees and Candidates
Turnout
Results
Statistical Data
SENATE
Created by
.
.
Voting Results
.
.
.
Voting Results for Committee
.
.
.
.
.
.
.
.
.
.
.
.
.
.
.
.
.
.
.
.
Polska
/
Szczecin
/
pyrzycki, pow.
...
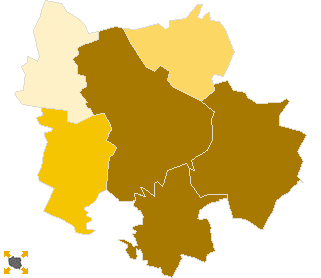
Komitet Wyborczy Platforma Obywatelska RP
List's Number:
8
No. of valid votes:
13630
No. of votes per List:
5269
38.66%
lack
21.90%
23.83%
25.76%
27.69%
29.62%
31.55%
33.48%
35.41%
37.34%
39.27%
not
of data
23.82%
25.75%
27.68%
29.61%
31.54%
33.47%
35.40%
37.33%
39.26%
41.20%
applicable
See also:
Turnout
Votes per Lists
Votes per Candidates
Information about Election Committee
Election results
Voting Results by location of ward electoral commission
.
.
Voting Results for Committee.
.
.
.
.
.
.
.
.
.
.
.
.
.
.
.
.
.
No.
Name
No. of entitled
to vote
No. of ballot papers
issued
No. of votes
No. of votes: per list / valid [%]
total
valid
per List
321201
Bielice, gm.
2312
918
918
872
191
21.90
321202
Kozielice, gm.
2086
798
798
764
267
34.95
321203
Lipiany, gm.
5011
2065
2060
1988
813
40.90
321204
Przelewice, gm.
4264
1589
1589
1522
626
41.13
321205
Pyrzyce, gm.
15779
7641
7639
7395
3033
41.01
321206
Warnice, gm.
2718
1127
1127
1089
339
31.13
pyrzycki, pow.
32170
14138
14131
13630
5269
38.66
.
.
Voting Results for Candidates
.
.
.
.
.
.
.
.
.
.
.
.
.
.
.
No.
Surname Names
No. of votes
% No. of votes per candidate/No. per list
% No. of votes per candidate/No. of valid votes
1
NITRAS Sławomir Witold
1410
26.76
10.34
2
KOCHAN Magdalena Maria
212
4.02
1.56
3
LITWIŃSKI Arkadiusz
201
3.81
1.47
4
URBAN Cezary
81
1.53
0.59
5
MARCINKIEWICZ Michał Piotr
590
11.19
4.33
6
KUŹMIŃSKI Wojciech Andrzej
1760
33.40
12.91
7
OŚWIĘCIMSKI Konstanty Tomasz
49
0.92
0.36
8
KURSZEWSKA Irena Helena
43
0.81
0.32
9
PREISS Sławomir Piotr
61
1.15
0.45
10
PAŃKA Urszula
66
1.25
0.48
11
RACINOWSKI Maciej Józef
18
0.34
0.13
12
BRODZIŃSKI Ryszard Eugeniusz
22
0.41
0.16
13
POTYRA Andrzej Marian
54
1.02
0.40
14
ZAREMBA Renata
205
3.89
1.50
15
KAWA Ryszard Kazimierz
36
0.68
0.26
16
BALICKA Jolanta Anna
68
1.29
0.50
17
PACHIS Bartłomiej Władysław
11
0.20
0.08
18
MICHALSKI Tomasz Ryszard
49
0.92
0.36
19
MAZEPA Arkadiusz Sobiesław
16
0.30
0.12
20
ANIKO Krzysztof
17
0.32
0.12
21
STANISŁAWSKI Tomasz Marcin
19
0.36
0.14
22
NAGAY Leszek Jan
48
0.91
0.35
23
LEWOC Wiesław Antoni
4
0.07
0.03
24
ŁODZIEWSKI Zbigniew Tomasz
87
1.65
0.64
25
KOŚCIUKIEWICZ Małgorzata Irena
39
0.74
0.29
26
ATAMAŃCZUK Cezary Łukasz
103
1.95
0.76
Σ
5269
100.00
38.65
.
.
Voting Results by location of ward electoral commission.
.
.
.
.
.
.
.
.
.
.
.
.
.
.
.
.
.
No.
Name
No. of entitled
to vote
No. of ballot
papers issued
No. of votes
No. of votes: per list / valid [%]
total
valid
per List
1
City
14542
7343
7338
7126
3133
43.97
2
Country
17628
6795
6793
6504
2136
32.84
.
Voting Results by number of inhabitants of commune
.
1
to 5 000
7116
2843
2843
2725
797
29.25
2
from 5 001 to 10 000
9275
3654
3649
3510
1439
41.00
3
from 10 001 to 20 000
15779
7641
7639
7395
3033
41.01
4
from 20 001 to 50 000
0
0
0
0
0
0.00
5
from 50 001 to 100 000
0
0
0
0
0
0.00
6
from 100 001 to 200 000
0
0
0
0
0
0.00
7
from 200 001 to 500 000
0
0
0
0
0
0.00
8
over 500 000
0
0
0
0
0
0.00
Legal Acts
Documents
Electoral Bodies
Election Committees and Candidates
Turnout
Results
Statistical Data
SENATE
Created by
Copyright © 2007
Mikrobit Sp. z o.o.
. All Rights Reserved.
top