.
.
Legal Acts
Documents
Electoral Bodies
Election Committees and Candidates
Turnout
Results
Statistical Data
SENATE
Created by
.
.
Voting Results
.
.
.
Voting Results for Committee
.
.
.
.
.
.
.
.
.
.
.
.
.
.
.
.
.
.
.
.
Polska
/
Szczecin
/
kamieński, pow.
...
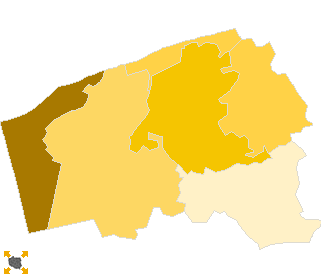
Komitet Wyborczy Platforma Obywatelska RP
List's Number:
8
No. of valid votes:
18026
No. of votes per List:
8900
49.37%
lack
43.31%
44.37%
45.43%
46.49%
47.55%
48.61%
49.67%
50.73%
51.79%
52.85%
not
of data
44.36%
45.42%
46.48%
47.54%
48.60%
49.66%
50.72%
51.78%
52.84%
53.91%
applicable
See also:
Turnout
Votes per Lists
Votes per Candidates
Information about Election Committee
Election results
Voting Results by location of ward electoral commission
.
.
Voting Results for Committee.
.
.
.
.
.
.
.
.
.
.
.
.
.
.
.
.
.
No.
Name
No. of entitled
to vote
No. of ballot papers
issued
No. of votes
No. of votes: per list / valid [%]
total
valid
per List
320701
Dziwnów, gm.
3576
1996
1996
1912
946
49.48
320702
Golczewo, gm.
4813
2038
2038
1967
852
43.31
320703
Kamień Pomorski, gm.
12167
5969
5969
5845
2947
50.42
320704
Międzyzdroje, gm.
5485
2898
2898
2829
1524
53.87
320705
Świerzno, gm.
3314
1231
1231
1195
584
48.87
320706
Wolin, gm.
9974
4383
4377
4278
2047
47.85
kamieński, pow.
39329
18515
18509
18026
8900
49.37
.
.
Voting Results for Candidates
.
.
.
.
.
.
.
.
.
.
.
.
.
.
.
No.
Surname Names
No. of votes
% No. of votes per candidate/No. per list
% No. of votes per candidate/No. of valid votes
1
NITRAS Sławomir Witold
2873
32.28
15.94
2
KOCHAN Magdalena Maria
449
5.04
2.49
3
LITWIŃSKI Arkadiusz
209
2.34
1.16
4
URBAN Cezary
127
1.42
0.70
5
MARCINKIEWICZ Michał Piotr
893
10.03
4.95
6
KUŹMIŃSKI Wojciech Andrzej
66
0.74
0.37
7
OŚWIĘCIMSKI Konstanty Tomasz
604
6.78
3.35
8
KURSZEWSKA Irena Helena
229
2.57
1.27
9
PREISS Sławomir Piotr
60
0.67
0.33
10
PAŃKA Urszula
99
1.11
0.55
11
RACINOWSKI Maciej Józef
33
0.37
0.18
12
BRODZIŃSKI Ryszard Eugeniusz
43
0.48
0.24
13
POTYRA Andrzej Marian
37
0.41
0.21
14
ZAREMBA Renata
405
4.55
2.25
15
KAWA Ryszard Kazimierz
1199
13.47
6.65
16
BALICKA Jolanta Anna
131
1.47
0.73
17
PACHIS Bartłomiej Władysław
17
0.19
0.09
18
MICHALSKI Tomasz Ryszard
37
0.41
0.21
19
MAZEPA Arkadiusz Sobiesław
27
0.30
0.15
20
ANIKO Krzysztof
27
0.30
0.15
21
STANISŁAWSKI Tomasz Marcin
34
0.38
0.19
22
NAGAY Leszek Jan
76
0.85
0.42
23
LEWOC Wiesław Antoni
10
0.11
0.06
24
ŁODZIEWSKI Zbigniew Tomasz
18
0.20
0.10
25
KOŚCIUKIEWICZ Małgorzata Irena
1087
12.21
6.03
26
ATAMAŃCZUK Cezary Łukasz
110
1.23
0.61
Σ
8900
100.00
49.37
.
.
Voting Results by location of ward electoral commission.
.
.
.
.
.
.
.
.
.
.
.
.
.
.
.
.
.
No.
Name
No. of entitled
to vote
No. of ballot
papers issued
No. of votes
No. of votes: per list / valid [%]
total
valid
per List
1
City
22254
11626
11620
11351
5862
51.64
2
Country
17075
6889
6889
6675
3038
45.51
.
Voting Results by number of inhabitants of commune
.
1
to 5 000
6890
3227
3227
3107
1530
49.24
2
from 5 001 to 10 000
10298
4936
4936
4796
2376
49.54
3
from 10 001 to 20 000
22141
10352
10346
10123
4994
49.33
4
from 20 001 to 50 000
0
0
0
0
0
0.00
5
from 50 001 to 100 000
0
0
0
0
0
0.00
6
from 100 001 to 200 000
0
0
0
0
0
0.00
7
from 200 001 to 500 000
0
0
0
0
0
0.00
8
over 500 000
0
0
0
0
0
0.00
Legal Acts
Documents
Electoral Bodies
Election Committees and Candidates
Turnout
Results
Statistical Data
SENATE
Created by
Copyright © 2007
Mikrobit Sp. z o.o.
. All Rights Reserved.
top