.
.
Legal Acts
Documents
Electoral Bodies
Election Committees and Candidates
Turnout
Results
Statistical Data
SENATE
Created by
.
.
Voting Results
.
.
.
Voting Results for Committee
.
.
.
.
.
.
.
.
.
.
.
.
.
.
.
.
.
.
.
.
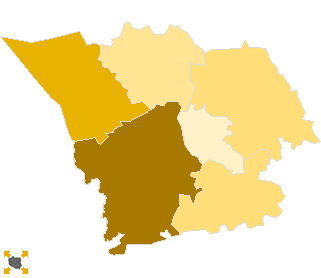
Polska
/
Szczecin
/
goleniowski, pow.
...
Komitet Wyborczy Platforma Obywatelska RP
List's Number:
8
No. of valid votes:
29723
No. of votes per List:
14399
48.44%
lack
35.56%
37.56%
39.56%
41.56%
43.56%
45.56%
47.56%
49.56%
51.56%
53.56%
not
of data
37.55%
39.55%
41.55%
43.55%
45.55%
47.55%
49.55%
51.55%
53.55%
55.56%
applicable
See also:
Turnout
Votes per Lists
Votes per Candidates
Information about Election Committee
Election results
Voting Results by location of ward electoral commission
.
.
Voting Results for Committee.
.
.
.
.
.
.
.
.
.
.
.
.
.
.
.
.
.
No.
Name
No. of entitled
to vote
No. of ballot papers
issued
No. of votes
No. of votes: per list / valid [%]
total
valid
per List
320402
Goleniów, gm.
27329
14470
14468
14209
7888
55.51
320403
Maszewo, gm.
6215
2461
2461
2398
1015
42.33
320404
Nowogard, gm.
19930
9535
9516
9284
3869
41.67
320405
Osina, gm.
2206
941
941
911
324
35.57
320406
Przybiernów, gm.
4135
1585
1585
1536
612
39.84
320407
Stepnica, gm.
3750
1429
1429
1385
691
49.89
goleniowski, pow.
63565
30421
30400
29723
14399
48.44
.
.
Voting Results for Candidates
.
.
.
.
.
.
.
.
.
.
.
.
.
.
.
No.
Surname Names
No. of votes
% No. of votes per candidate/No. per list
% No. of votes per candidate/No. of valid votes
1
NITRAS Sławomir Witold
4066
28.23
13.68
2
KOCHAN Magdalena Maria
5537
38.45
18.63
3
LITWIŃSKI Arkadiusz
289
2.00
0.97
4
URBAN Cezary
213
1.47
0.72
5
MARCINKIEWICZ Michał Piotr
1445
10.03
4.86
6
KUŹMIŃSKI Wojciech Andrzej
135
0.93
0.45
7
OŚWIĘCIMSKI Konstanty Tomasz
103
0.71
0.35
8
KURSZEWSKA Irena Helena
110
0.76
0.37
9
PREISS Sławomir Piotr
107
0.74
0.36
10
PAŃKA Urszula
154
1.06
0.52
11
RACINOWSKI Maciej Józef
39
0.27
0.13
12
BRODZIŃSKI Ryszard Eugeniusz
64
0.44
0.22
13
POTYRA Andrzej Marian
56
0.38
0.19
14
ZAREMBA Renata
617
4.28
2.08
15
KAWA Ryszard Kazimierz
68
0.47
0.23
16
BALICKA Jolanta Anna
256
1.77
0.86
17
PACHIS Bartłomiej Władysław
35
0.24
0.12
18
MICHALSKI Tomasz Ryszard
106
0.73
0.36
19
MAZEPA Arkadiusz Sobiesław
27
0.18
0.09
20
ANIKO Krzysztof
30
0.20
0.10
21
STANISŁAWSKI Tomasz Marcin
592
4.11
1.99
22
NAGAY Leszek Jan
107
0.74
0.36
23
LEWOC Wiesław Antoni
2
0.01
0.01
24
ŁODZIEWSKI Zbigniew Tomasz
17
0.11
0.06
25
KOŚCIUKIEWICZ Małgorzata Irena
78
0.54
0.26
26
ATAMAŃCZUK Cezary Łukasz
146
1.01
0.49
Σ
14399
100.00
48.44
.
.
Voting Results by location of ward electoral commission.
.
.
.
.
.
.
.
.
.
.
.
.
.
.
.
.
.
No.
Name
No. of entitled
to vote
No. of ballot
papers issued
No. of votes
No. of votes: per list / valid [%]
total
valid
per List
1
City
36856
20363
20343
19959
10410
52.16
2
Country
26709
10058
10057
9764
3989
40.85
.
Voting Results by number of inhabitants of commune
.
1
to 5 000
5956
2370
2370
2296
1015
44.21
2
from 5 001 to 10 000
10350
4046
4046
3934
1627
41.36
3
from 10 001 to 20 000
0
0
0
0
0
0.00
4
from 20 001 to 50 000
47259
24005
23984
23493
11757
50.04
5
from 50 001 to 100 000
0
0
0
0
0
0.00
6
from 100 001 to 200 000
0
0
0
0
0
0.00
7
from 200 001 to 500 000
0
0
0
0
0
0.00
8
over 500 000
0
0
0
0
0
0.00
Legal Acts
Documents
Electoral Bodies
Election Committees and Candidates
Turnout
Results
Statistical Data
SENATE
Created by
Copyright © 2007
Mikrobit Sp. z o.o.
. All Rights Reserved.
top