.
.
Legal Acts
Documents
Electoral Bodies
Election Committees and Candidates
Turnout
Results
Statistical Data
SENATE
Created by
.
.
Voting Results
.
.
.
Voting Results for Committee
.
.
.
.
.
.
.
.
.
.
.
.
.
.
.
.
.
.
.
.
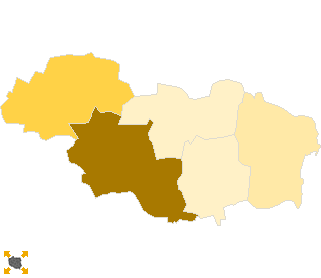
Polska
/
Kalisz
/
rawicki, pow.
...
Komitet Wyborczy Platforma Obywatelska RP
List's Number:
8
No. of valid votes:
21946
No. of votes per List:
9112
41.52%
lack
25.88%
28.25%
30.62%
32.99%
35.36%
37.73%
40.10%
42.47%
44.84%
47.21%
not
of data
28.24%
30.61%
32.98%
35.35%
37.72%
40.09%
42.46%
44.83%
47.20%
49.58%
applicable
See also:
Turnout
Votes per Lists
Votes per Candidates
Information about Election Committee
Election results
Voting Results by location of ward electoral commission
.
.
Voting Results for Committee.
.
.
.
.
.
.
.
.
.
.
.
.
.
.
.
.
.
No.
Name
No. of entitled
to vote
No. of ballot papers
issued
No. of votes
No. of votes: per list / valid [%]
total
valid
per List
302201
Bojanowo, gm.
6912
3078
3077
2966
1181
39.82
302202
Jutrosin, gm.
5430
2291
2291
2193
625
28.50
302203
Miejska Górka, gm.
7268
3162
3159
2962
812
27.41
302204
Pakosław, gm.
3428
1604
1602
1518
393
25.89
302205
Rawicz, gm.
24267
12696
12690
12307
6101
49.57
rawicki, pow.
47305
22831
22819
21946
9112
41.52
.
.
Voting Results for Candidates
.
.
.
.
.
.
.
.
.
.
.
.
.
.
.
No.
Surname Names
No. of votes
% No. of votes per candidate/No. per list
% No. of votes per candidate/No. of valid votes
1
GRUPIŃSKI Rafał Szymon
1851
20.31
8.43
2
ZIEMNIAK Wojciech Stanisław
2076
22.78
9.46
3
URBANIAK Jarosław
211
2.31
0.96
4
ORZECHOWSKI Maciej Bolesław
673
7.38
3.07
5
HENCZYCA Bożena Katarzyna
176
1.93
0.80
6
SITARZ Witold Jan
54
0.59
0.25
7
BOROWIAK Łukasz
394
4.32
1.80
8
MARTUZALSKI Stanisław Franciszek
58
0.63
0.26
9
SUCHANECKI Mariusz Grzegorz
1886
20.69
8.59
10
JAROSZEWSKI Łukasz Krzysztof
82
0.89
0.37
11
DWORCZAK Leszek Kazimierz
82
0.89
0.37
12
BUŁGARYN Paweł Piotr
51
0.55
0.23
13
FOLTYŃSKI Sławomir
36
0.39
0.16
14
PIETRASZEK Dariusz Andrzej
99
1.08
0.45
15
WŁODARCZYK Mirosław
118
1.29
0.54
16
ŁUCZAK Alicja
313
3.43
1.43
17
ORCZYK Agnieszka
137
1.50
0.62
18
ZASIADCZYK Jacek Paweł
29
0.31
0.13
19
REŚLIŃSKI Fabian Paweł
50
0.54
0.23
20
FLORCZAK Robert
39
0.42
0.18
21
WITCZAK Agnieszka
390
4.28
1.78
22
BARANOWSKI Remigiusz
49
0.53
0.22
23
DOMAŃSKI Jarosław
189
2.07
0.86
24
POTEMPA Piotr Karol
69
0.75
0.31
Σ
9112
100.00
41.52
.
.
Voting Results by location of ward electoral commission.
.
.
.
.
.
.
.
.
.
.
.
.
.
.
.
.
.
No.
Name
No. of entitled
to vote
No. of ballot
papers issued
No. of votes
No. of votes: per list / valid [%]
total
valid
per List
1
City
24349
13414
13406
12961
6516
50.27
2
Country
22956
9417
9413
8985
2596
28.89
.
Voting Results by number of inhabitants of commune
.
1
to 5 000
3428
1604
1602
1518
393
25.89
2
from 5 001 to 10 000
19610
8531
8527
8121
2618
32.24
3
from 10 001 to 20 000
0
0
0
0
0
0.00
4
from 20 001 to 50 000
24267
12696
12690
12307
6101
49.57
5
from 50 001 to 100 000
0
0
0
0
0
0.00
6
from 100 001 to 200 000
0
0
0
0
0
0.00
7
from 200 001 to 500 000
0
0
0
0
0
0.00
8
over 500 000
0
0
0
0
0
0.00
Legal Acts
Documents
Electoral Bodies
Election Committees and Candidates
Turnout
Results
Statistical Data
SENATE
Created by
Copyright © 2007
Mikrobit Sp. z o.o.
. All Rights Reserved.
top