.
.
Legal Acts
Documents
Electoral Bodies
Election Committees and Candidates
Turnout
Results
Statistical Data
SENATE
Created by
.
.
Voting Results
.
.
.
Voting Results for Committee
.
.
.
.
.
.
.
.
.
.
.
.
.
.
.
.
.
.
.
.
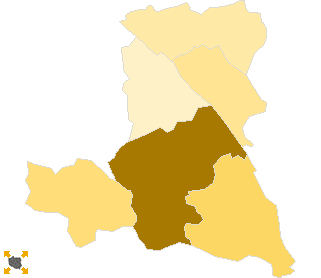
Polska
/
Kalisz
/
pleszewski, pow.
...
Komitet Wyborczy Platforma Obywatelska RP
List's Number:
8
No. of valid votes:
21768
No. of votes per List:
7026
32.28%
lack
17.55%
19.80%
22.05%
24.30%
26.55%
28.80%
31.05%
33.30%
35.55%
37.80%
not
of data
19.79%
22.04%
24.29%
26.54%
28.79%
31.04%
33.29%
35.54%
37.79%
40.05%
applicable
See also:
Turnout
Votes per Lists
Votes per Candidates
Information about Election Committee
Election results
Voting Results by location of ward electoral commission
.
.
Voting Results for Committee.
.
.
.
.
.
.
.
.
.
.
.
.
.
.
.
.
.
No.
Name
No. of entitled
to vote
No. of ballot papers
issued
No. of votes
No. of votes: per list / valid [%]
total
valid
per List
302001
Chocz, gm.
3664
1594
1594
1520
345
22.70
302002
Czermin, gm.
3747
1707
1707
1652
290
17.55
302003
Dobrzyca, gm.
6435
2963
2963
2771
729
26.31
302004
Gizałki, gm.
3546
1305
1305
1211
245
20.23
302005
Gołuchów, gm.
7553
3532
3523
3376
917
27.16
302006
Pleszew, gm.
23734
11619
11606
11238
4500
40.04
pleszewski, pow.
48679
22720
22698
21768
7026
32.28
.
.
Voting Results for Candidates
.
.
.
.
.
.
.
.
.
.
.
.
.
.
.
No.
Surname Names
No. of votes
% No. of votes per candidate/No. per list
% No. of votes per candidate/No. of valid votes
1
GRUPIŃSKI Rafał Szymon
1850
26.33
8.50
2
ZIEMNIAK Wojciech Stanisław
182
2.59
0.84
3
URBANIAK Jarosław
504
7.17
2.32
4
ORZECHOWSKI Maciej Bolesław
371
5.28
1.70
5
HENCZYCA Bożena Katarzyna
129
1.83
0.59
6
SITARZ Witold Jan
387
5.50
1.78
7
BOROWIAK Łukasz
159
2.26
0.73
8
MARTUZALSKI Stanisław Franciszek
240
3.41
1.10
9
SUCHANECKI Mariusz Grzegorz
58
0.82
0.27
10
JAROSZEWSKI Łukasz Krzysztof
1587
22.58
7.29
11
DWORCZAK Leszek Kazimierz
40
0.56
0.18
12
BUŁGARYN Paweł Piotr
43
0.61
0.20
13
FOLTYŃSKI Sławomir
58
0.82
0.27
14
PIETRASZEK Dariusz Andrzej
41
0.58
0.19
15
WŁODARCZYK Mirosław
178
2.53
0.82
16
ŁUCZAK Alicja
253
3.60
1.16
17
ORCZYK Agnieszka
151
2.14
0.69
18
ZASIADCZYK Jacek Paweł
15
0.21
0.07
19
REŚLIŃSKI Fabian Paweł
217
3.08
1.00
20
FLORCZAK Robert
48
0.68
0.22
21
WITCZAK Agnieszka
354
5.03
1.63
22
BARANOWSKI Remigiusz
47
0.66
0.22
23
DOMAŃSKI Jarosław
32
0.45
0.15
24
POTEMPA Piotr Karol
82
1.16
0.38
Σ
7026
100.00
32.27
.
.
Voting Results by location of ward electoral commission.
.
.
.
.
.
.
.
.
.
.
.
.
.
.
.
.
.
No.
Name
No. of entitled
to vote
No. of ballot
papers issued
No. of votes
No. of votes: per list / valid [%]
total
valid
per List
1
City
14533
7921
7908
7687
3397
44.19
2
Country
34146
14799
14790
14081
3629
25.77
.
Voting Results by number of inhabitants of commune
.
1
to 5 000
10957
4606
4606
4383
880
20.08
2
from 5 001 to 10 000
13988
6495
6486
6147
1646
26.78
3
from 10 001 to 20 000
0
0
0
0
0
0.00
4
from 20 001 to 50 000
23734
11619
11606
11238
4500
40.04
5
from 50 001 to 100 000
0
0
0
0
0
0.00
6
from 100 001 to 200 000
0
0
0
0
0
0.00
7
from 200 001 to 500 000
0
0
0
0
0
0.00
8
over 500 000
0
0
0
0
0
0.00
Legal Acts
Documents
Electoral Bodies
Election Committees and Candidates
Turnout
Results
Statistical Data
SENATE
Created by
Copyright © 2007
Mikrobit Sp. z o.o.
. All Rights Reserved.
top