.
.
Legal Acts
Documents
Electoral Bodies
Election Committees and Candidates
Turnout
Results
Statistical Data
SENATE
Created by
.
.
Voting Results
.
.
.
Voting Results for Committee
.
.
.
.
.
.
.
.
.
.
.
.
.
.
.
.
.
.
.
.
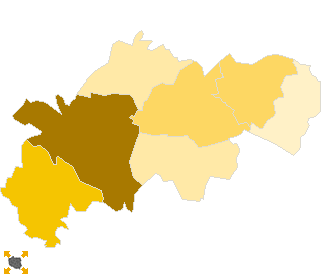
Polska
/
Kalisz
/
ostrzeszowski, pow.
...
Komitet Wyborczy Platforma Obywatelska RP
List's Number:
8
No. of valid votes:
18899
No. of votes per List:
5167
27.34%
lack
13.52%
15.63%
17.74%
19.85%
21.96%
24.07%
26.18%
28.29%
30.40%
32.51%
not
of data
15.62%
17.73%
19.84%
21.95%
24.06%
26.17%
28.28%
30.39%
32.50%
34.62%
applicable
See also:
Turnout
Votes per Lists
Votes per Candidates
Information about Election Committee
Election results
Voting Results by location of ward electoral commission
.
.
Voting Results for Committee.
.
.
.
.
.
.
.
.
.
.
.
.
.
.
.
.
.
No.
Name
No. of entitled
to vote
No. of ballot papers
issued
No. of votes
No. of votes: per list / valid [%]
total
valid
per List
301801
Czajków, gm.
1962
787
787
754
102
13.53
301802
Doruchów, gm.
3874
1698
1696
1624
282
17.36
301803
Grabów nad Prosną, gm.
6010
2765
2765
2642
624
23.62
301804
Kobyla Góra, gm.
4481
2014
2014
1936
521
26.91
301805
Kraszewice, gm.
2790
1197
1195
1149
253
22.02
301806
Mikstat, gm.
4831
2037
2037
1942
322
16.58
301807
Ostrzeszów, gm.
18325
9102
9102
8852
3063
34.60
ostrzeszowski, pow.
42273
19600
19596
18899
5167
27.34
.
.
Voting Results for Candidates
.
.
.
.
.
.
.
.
.
.
.
.
.
.
.
No.
Surname Names
No. of votes
% No. of votes per candidate/No. per list
% No. of votes per candidate/No. of valid votes
1
GRUPIŃSKI Rafał Szymon
1532
29.64
8.11
2
ZIEMNIAK Wojciech Stanisław
327
6.32
1.73
3
URBANIAK Jarosław
929
17.97
4.92
4
ORZECHOWSKI Maciej Bolesław
333
6.44
1.76
5
HENCZYCA Bożena Katarzyna
149
2.88
0.79
6
SITARZ Witold Jan
154
2.98
0.81
7
BOROWIAK Łukasz
100
1.93
0.53
8
MARTUZALSKI Stanisław Franciszek
37
0.71
0.20
9
SUCHANECKI Mariusz Grzegorz
404
7.81
2.14
10
JAROSZEWSKI Łukasz Krzysztof
55
1.06
0.29
11
DWORCZAK Leszek Kazimierz
29
0.56
0.15
12
BUŁGARYN Paweł Piotr
50
0.96
0.26
13
FOLTYŃSKI Sławomir
33
0.63
0.17
14
PIETRASZEK Dariusz Andrzej
31
0.59
0.16
15
WŁODARCZYK Mirosław
57
1.10
0.30
16
ŁUCZAK Alicja
212
4.10
1.12
17
ORCZYK Agnieszka
77
1.49
0.41
18
ZASIADCZYK Jacek Paweł
131
2.53
0.69
19
REŚLIŃSKI Fabian Paweł
11
0.21
0.06
20
FLORCZAK Robert
36
0.69
0.19
21
WITCZAK Agnieszka
333
6.44
1.76
22
BARANOWSKI Remigiusz
31
0.59
0.16
23
DOMAŃSKI Jarosław
42
0.81
0.22
24
POTEMPA Piotr Karol
74
1.43
0.39
Σ
5167
100.00
27.34
.
.
Voting Results by location of ward electoral commission.
.
.
.
.
.
.
.
.
.
.
.
.
.
.
.
.
.
No.
Name
No. of entitled
to vote
No. of ballot
papers issued
No. of votes
No. of votes: per list / valid [%]
total
valid
per List
1
City
15024
8181
8181
7975
2932
36.76
2
Country
27249
11419
11415
10924
2235
20.46
.
Voting Results by number of inhabitants of commune
.
1
to 5 000
4752
1984
1982
1903
355
18.65
2
from 5 001 to 10 000
19196
8514
8512
8144
1749
21.48
3
from 10 001 to 20 000
0
0
0
0
0
0.00
4
from 20 001 to 50 000
18325
9102
9102
8852
3063
34.60
5
from 50 001 to 100 000
0
0
0
0
0
0.00
6
from 100 001 to 200 000
0
0
0
0
0
0.00
7
from 200 001 to 500 000
0
0
0
0
0
0.00
8
over 500 000
0
0
0
0
0
0.00
Legal Acts
Documents
Electoral Bodies
Election Committees and Candidates
Turnout
Results
Statistical Data
SENATE
Created by
Copyright © 2007
Mikrobit Sp. z o.o.
. All Rights Reserved.
top