.
.
Legal Acts
Documents
Electoral Bodies
Election Committees and Candidates
Turnout
Results
Statistical Data
SENATE
Created by
.
.
Voting Results
.
.
.
Voting Results for Committee
.
.
.
.
.
.
.
.
.
.
.
.
.
.
.
.
.
.
.
.
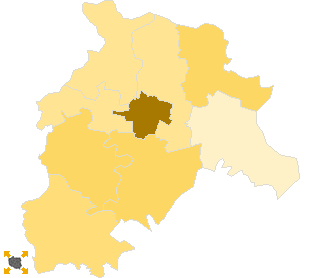
Polska
/
Kalisz
/
ostrowski, pow.
...
Komitet Wyborczy Platforma Obywatelska RP
List's Number:
8
No. of valid votes:
64846
No. of votes per List:
24909
38.41%
lack
20.81%
23.38%
25.95%
28.52%
31.09%
33.66%
36.23%
38.80%
41.37%
43.94%
not
of data
23.37%
25.94%
28.51%
31.08%
33.65%
36.22%
38.79%
41.36%
43.93%
46.51%
applicable
See also:
Turnout
Votes per Lists
Votes per Candidates
Information about Election Committee
Election results
Voting Results by location of ward electoral commission
.
.
Voting Results for Committee.
.
.
.
.
.
.
.
.
.
.
.
.
.
.
.
.
.
No.
Name
No. of entitled
to vote
No. of ballot papers
issued
No. of votes
No. of votes: per list / valid [%]
total
valid
per List
301702
Nowe Skalmierzyce, gm.
11818
5434
5396
5230
1748
33.42
301703
Odolanów, gm.
10647
5248
5248
5030
1591
31.63
301704
Ostrów Wielkopolski, gm.
13831
6687
6687
6520
1786
27.39
301701
Ostrów Wielkopolski, m.
59775
35517
35505
34744
16145
46.47
301705
Przygodzice, gm.
8787
4531
4529
4382
1369
31.24
301706
Raszków, gm.
8756
3933
3932
3836
1006
26.23
301707
Sieroszewice, gm.
7385
3138
3138
3027
630
20.81
301708
Sośnie, gm.
4962
2178
2178
2077
634
30.52
ostrowski, pow.
125961
66666
66613
64846
24909
38.41
.
.
Voting Results for Candidates
.
.
.
.
.
.
.
.
.
.
.
.
.
.
.
No.
Surname Names
No. of votes
% No. of votes per candidate/No. per list
% No. of votes per candidate/No. of valid votes
1
GRUPIŃSKI Rafał Szymon
3730
14.97
5.75
2
ZIEMNIAK Wojciech Stanisław
537
2.15
0.83
3
URBANIAK Jarosław
13575
54.49
20.93
4
ORZECHOWSKI Maciej Bolesław
1265
5.07
1.95
5
HENCZYCA Bożena Katarzyna
348
1.39
0.54
6
SITARZ Witold Jan
991
3.97
1.53
7
BOROWIAK Łukasz
321
1.28
0.50
8
MARTUZALSKI Stanisław Franciszek
316
1.26
0.49
9
SUCHANECKI Mariusz Grzegorz
100
0.40
0.15
10
JAROSZEWSKI Łukasz Krzysztof
133
0.53
0.21
11
DWORCZAK Leszek Kazimierz
109
0.43
0.17
12
BUŁGARYN Paweł Piotr
86
0.34
0.13
13
FOLTYŃSKI Sławomir
94
0.37
0.14
14
PIETRASZEK Dariusz Andrzej
366
1.46
0.56
15
WŁODARCZYK Mirosław
223
0.89
0.34
16
ŁUCZAK Alicja
682
2.73
1.05
17
ORCZYK Agnieszka
267
1.07
0.41
18
ZASIADCZYK Jacek Paweł
35
0.14
0.05
19
REŚLIŃSKI Fabian Paweł
33
0.13
0.05
20
FLORCZAK Robert
139
0.55
0.21
21
WITCZAK Agnieszka
1066
4.27
1.64
22
BARANOWSKI Remigiusz
95
0.38
0.15
23
DOMAŃSKI Jarosław
140
0.56
0.22
24
POTEMPA Piotr Karol
258
1.03
0.40
Σ
24909
100.00
38.41
.
.
Voting Results by location of ward electoral commission.
.
.
.
.
.
.
.
.
.
.
.
.
.
.
.
.
.
No.
Name
No. of entitled
to vote
No. of ballot
papers issued
No. of votes
No. of votes: per list / valid [%]
total
valid
per List
1
City
70138
40992
40974
40026
18364
45.88
2
Country
55823
25674
25639
24820
6545
26.37
.
Voting Results by number of inhabitants of commune
.
1
to 5 000
0
0
0
0
0
0.00
2
from 5 001 to 10 000
12347
5316
5316
5104
1264
24.76
3
from 10 001 to 20 000
53839
25833
25792
24998
7500
30.00
4
from 20 001 to 50 000
0
0
0
0
0
0.00
5
from 50 001 to 100 000
59775
35517
35505
34744
16145
46.47
6
from 100 001 to 200 000
0
0
0
0
0
0.00
7
from 200 001 to 500 000
0
0
0
0
0
0.00
8
over 500 000
0
0
0
0
0
0.00
Legal Acts
Documents
Electoral Bodies
Election Committees and Candidates
Turnout
Results
Statistical Data
SENATE
Created by
Copyright © 2007
Mikrobit Sp. z o.o.
. All Rights Reserved.
top