.
.
Legal Acts
Documents
Electoral Bodies
Election Committees and Candidates
Turnout
Results
Statistical Data
SENATE
Created by
.
.
Voting Results
.
.
.
Voting Results for Committee
.
.
.
.
.
.
.
.
.
.
.
.
.
.
.
.
.
.
.
.
Polska
/
Kalisz
/
leszczyński, pow.
...
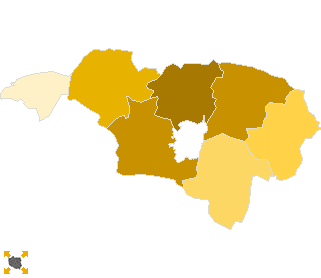
Komitet Wyborczy Platforma Obywatelska RP
List's Number:
8
No. of valid votes:
17855
No. of votes per List:
6662
37.31%
lack
25.39%
27.16%
28.93%
30.70%
32.47%
34.24%
36.01%
37.78%
39.55%
41.32%
not
of data
27.15%
28.92%
30.69%
32.46%
34.23%
36.00%
37.77%
39.54%
41.31%
43.09%
applicable
See also:
Turnout
Votes per Lists
Votes per Candidates
Information about Election Committee
Election results
Voting Results by location of ward electoral commission
.
.
Voting Results for Committee.
.
.
.
.
.
.
.
.
.
.
.
.
.
.
.
.
.
No.
Name
No. of entitled
to vote
No. of ballot papers
issued
No. of votes
No. of votes: per list / valid [%]
total
valid
per List
301301
Krzemieniewo, gm.
6587
2870
2869
2763
969
35.07
301302
Lipno, gm.
4425
2220
2220
2133
918
43.04
301303
Osieczna, gm.
6710
3137
3137
3026
1205
39.82
301304
Rydzyna, gm.
6265
3133
3133
3033
1025
33.79
301305
Święciechowa, gm.
5521
2596
2594
2530
1025
40.51
301306
Wijewo, gm.
2629
1328
1328
1272
323
25.39
301307
Włoszakowice, gm.
6540
3213
3213
3098
1197
38.64
leszczyński, pow.
38677
18497
18494
17855
6662
37.31
.
.
Voting Results for Candidates
.
.
.
.
.
.
.
.
.
.
.
.
.
.
.
No.
Surname Names
No. of votes
% No. of votes per candidate/No. per list
% No. of votes per candidate/No. of valid votes
1
GRUPIŃSKI Rafał Szymon
861
12.92
4.82
2
ZIEMNIAK Wojciech Stanisław
2623
39.37
14.69
3
URBANIAK Jarosław
133
1.99
0.74
4
ORZECHOWSKI Maciej Bolesław
271
4.06
1.52
5
HENCZYCA Bożena Katarzyna
75
1.12
0.42
6
SITARZ Witold Jan
39
0.58
0.22
7
BOROWIAK Łukasz
1224
18.37
6.86
8
MARTUZALSKI Stanisław Franciszek
36
0.54
0.20
9
SUCHANECKI Mariusz Grzegorz
41
0.61
0.23
10
JAROSZEWSKI Łukasz Krzysztof
39
0.58
0.22
11
DWORCZAK Leszek Kazimierz
62
0.93
0.35
12
BUŁGARYN Paweł Piotr
451
6.76
2.53
13
FOLTYŃSKI Sławomir
24
0.36
0.13
14
PIETRASZEK Dariusz Andrzej
18
0.27
0.10
15
WŁODARCZYK Mirosław
44
0.66
0.25
16
ŁUCZAK Alicja
162
2.43
0.91
17
ORCZYK Agnieszka
54
0.81
0.30
18
ZASIADCZYK Jacek Paweł
7
0.10
0.04
19
REŚLIŃSKI Fabian Paweł
11
0.16
0.06
20
FLORCZAK Robert
214
3.21
1.20
21
WITCZAK Agnieszka
172
2.58
0.96
22
BARANOWSKI Remigiusz
37
0.55
0.21
23
DOMAŃSKI Jarosław
31
0.46
0.17
24
POTEMPA Piotr Karol
33
0.49
0.18
Σ
6662
100.00
37.31
.
.
Voting Results by location of ward electoral commission.
.
.
.
.
.
.
.
.
.
.
.
.
.
.
.
.
.
No.
Name
No. of entitled
to vote
No. of ballot
papers issued
No. of votes
No. of votes: per list / valid [%]
total
valid
per List
1
City
3770
2229
2229
2162
933
43.15
2
Country
34907
16268
16265
15693
5729
36.51
.
Voting Results by number of inhabitants of commune
.
1
to 5 000
2629
1328
1328
1272
323
25.39
2
from 5 001 to 10 000
36048
17169
17166
16583
6339
38.23
3
from 10 001 to 20 000
0
0
0
0
0
0.00
4
from 20 001 to 50 000
0
0
0
0
0
0.00
5
from 50 001 to 100 000
0
0
0
0
0
0.00
6
from 100 001 to 200 000
0
0
0
0
0
0.00
7
from 200 001 to 500 000
0
0
0
0
0
0.00
8
over 500 000
0
0
0
0
0
0.00
Legal Acts
Documents
Electoral Bodies
Election Committees and Candidates
Turnout
Results
Statistical Data
SENATE
Created by
Copyright © 2007
Mikrobit Sp. z o.o.
. All Rights Reserved.
top