.
.
Legal Acts
Documents
Electoral Bodies
Election Committees and Candidates
Turnout
Results
Statistical Data
SENATE
Created by
.
.
Voting Results
.
.
.
Voting Results for Committee
.
.
.
.
.
.
.
.
.
.
.
.
.
.
.
.
.
.
.
.
Polska
/
Kalisz
/
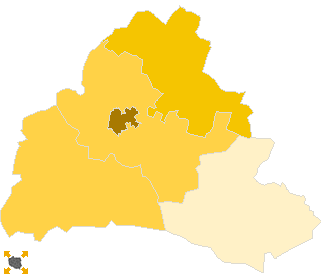
kościański, pow.
...
Komitet Wyborczy Platforma Obywatelska RP
List's Number:
8
No. of valid votes:
30127
No. of votes per List:
13839
45.94%
lack
28.85%
31.45%
34.05%
36.65%
39.25%
41.85%
44.45%
47.05%
49.65%
52.25%
not
of data
31.44%
34.04%
36.64%
39.24%
41.84%
44.44%
47.04%
49.64%
52.24%
54.85%
applicable
See also:
Turnout
Votes per Lists
Votes per Candidates
Information about Election Committee
Election results
Voting Results by location of ward electoral commission
.
.
Voting Results for Committee.
.
.
.
.
.
.
.
.
.
.
.
.
.
.
.
.
.
No.
Name
No. of entitled
to vote
No. of ballot papers
issued
No. of votes
No. of votes: per list / valid [%]
total
valid
per List
301102
Czempiń, gm.
8807
4387
4386
4172
1885
45.18
301103
Kościan, gm.
11606
5680
5674
5423
2341
43.17
301101
Kościan, m.
19534
11443
11423
11155
6118
54.85
301104
Krzywiń, gm.
7607
3479
3476
3306
954
28.86
301105
Śmigiel, gm.
13646
6344
6343
6071
2541
41.85
kościański, pow.
61200
31333
31302
30127
13839
45.94
.
.
Voting Results for Candidates
.
.
.
.
.
.
.
.
.
.
.
.
.
.
.
No.
Surname Names
No. of votes
% No. of votes per candidate/No. per list
% No. of votes per candidate/No. of valid votes
1
GRUPIŃSKI Rafał Szymon
1372
9.91
4.55
2
ZIEMNIAK Wojciech Stanisław
10657
77.00
35.37
3
URBANIAK Jarosław
137
0.98
0.45
4
ORZECHOWSKI Maciej Bolesław
175
1.26
0.58
5
HENCZYCA Bożena Katarzyna
101
0.72
0.34
6
SITARZ Witold Jan
30
0.21
0.10
7
BOROWIAK Łukasz
327
2.36
1.09
8
MARTUZALSKI Stanisław Franciszek
31
0.22
0.10
9
SUCHANECKI Mariusz Grzegorz
25
0.18
0.08
10
JAROSZEWSKI Łukasz Krzysztof
36
0.26
0.12
11
DWORCZAK Leszek Kazimierz
138
0.99
0.46
12
BUŁGARYN Paweł Piotr
41
0.29
0.14
13
FOLTYŃSKI Sławomir
43
0.31
0.14
14
PIETRASZEK Dariusz Andrzej
22
0.15
0.07
15
WŁODARCZYK Mirosław
33
0.23
0.11
16
ŁUCZAK Alicja
179
1.29
0.59
17
ORCZYK Agnieszka
68
0.49
0.23
18
ZASIADCZYK Jacek Paweł
15
0.10
0.05
19
REŚLIŃSKI Fabian Paweł
6
0.04
0.02
20
FLORCZAK Robert
32
0.23
0.11
21
WITCZAK Agnieszka
241
1.74
0.80
22
BARANOWSKI Remigiusz
33
0.23
0.11
23
DOMAŃSKI Jarosław
19
0.13
0.06
24
POTEMPA Piotr Karol
78
0.56
0.26
Σ
13839
100.00
45.93
.
.
Voting Results by location of ward electoral commission.
.
.
.
.
.
.
.
.
.
.
.
.
.
.
.
.
.
No.
Name
No. of entitled
to vote
No. of ballot
papers issued
No. of votes
No. of votes: per list / valid [%]
total
valid
per List
1
City
31087
17601
17578
17044
8880
52.10
2
Country
30113
13732
13724
13083
4959
37.90
.
Voting Results by number of inhabitants of commune
.
1
to 5 000
0
0
0
0
0
0.00
2
from 5 001 to 10 000
7607
3479
3476
3306
954
28.86
3
from 10 001 to 20 000
34059
16411
16403
15666
6767
43.20
4
from 20 001 to 50 000
19534
11443
11423
11155
6118
54.85
5
from 50 001 to 100 000
0
0
0
0
0
0.00
6
from 100 001 to 200 000
0
0
0
0
0
0.00
7
from 200 001 to 500 000
0
0
0
0
0
0.00
8
over 500 000
0
0
0
0
0
0.00
Legal Acts
Documents
Electoral Bodies
Election Committees and Candidates
Turnout
Results
Statistical Data
SENATE
Created by
Copyright © 2007
Mikrobit Sp. z o.o.
. All Rights Reserved.
top