.
.
 
. .
Voting Results
.
. . Voting Results for Committee . .
. .
. . . . . . . . . . . . . . . .
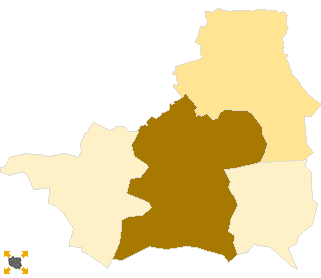
Polska / Kalisz / jarociński, pow. ...
Komitet Wyborczy Platforma Obywatelska RP
List's Number: 8
No. of valid votes: 26814
No. of votes per List: 9919
36.99%
lack22.54%24.59%26.64%28.69%30.74%32.79%34.84%36.89%38.94%40.99%not
of data24.58%26.63%28.68%30.73%32.78%34.83%36.88%38.93%40.98%43.04%applicable

See also:
. . Voting Results for Committee. . .
. .
. . . . . . . . . . . . .
No. Name No. of entitled
to vote
No. of ballot papers
issued
No. of votes No. of votes: per list / valid [%]
total valid per List
300601Jaraczewo, gm.635632393237303068322.54
300602Jarocin, gm.35599184521843818010774543.00
300603Kotlin, gm.549124642464234254923.44
300604Żerków, gm.817535573556343294227.45
  jarociński, pow. 55621 27712 27695 26814 9919 36.99

. . Voting Results for Candidates . .
. .
. . . . . . . . . . .
No. Surname Names No. of votes % No. of votes per candidate/No. per list % No. of votes per candidate/No. of valid votes
1GRUPIŃSKI Rafał Szymon125912.694.70
2ZIEMNIAK Wojciech Stanisław1631.640.61
3URBANIAK Jarosław4444.471.66
4ORZECHOWSKI Maciej Bolesław3533.551.32
5HENCZYCA Bożena Katarzyna780.780.29
6SITARZ Witold Jan700.700.26
7BOROWIAK Łukasz830.830.31
8MARTUZALSKI Stanisław Franciszek614961.9922.93
9SUCHANECKI Mariusz Grzegorz320.320.12
10JAROSZEWSKI Łukasz Krzysztof620.620.23
11DWORCZAK Leszek Kazimierz430.430.16
12BUŁGARYN Paweł Piotr260.260.10
13FOLTYŃSKI Sławomir290.290.11
14PIETRASZEK Dariusz Andrzej230.230.09
15WŁODARCZYK Mirosław700.700.26
16ŁUCZAK Alicja2072.080.77
17ORCZYK Agnieszka2912.931.09
18ZASIADCZYK Jacek Paweł110.110.04
19REŚLIŃSKI Fabian Paweł220.220.08
20FLORCZAK Robert1221.220.45
21WITCZAK Agnieszka2592.610.97
22BARANOWSKI Remigiusz320.320.12
23DOMAŃSKI Jarosław220.220.08
24POTEMPA Piotr Karol690.690.26
Σ   9919 100.00 36.99
 
. . Voting Results by location of ward electoral commission. . .
. .
. . . . . . . . . . . . .
No. Name No. of entitled
to vote
No. of ballot
papers issued
No. of votes No. of votes: per list / valid [%]
total valid per List
1City22887128931289012612580846.05
2Country32734148191480514202411128.95
. Voting Results by number of inhabitants of commune .
1to 5 000000000.00 
2from 5 001 to 10 00011847570357015372123222.93
3from 10 001 to 20 000817535573556343294227.45
4from 20 001 to 50 00035599184521843818010774543.00
5from 50 001 to 100 000000000.00 
6from 100 001 to 200 000000000.00 
7from 200 001 to 500 000000000.00 
8over 500 000000000.00 

  Legal Acts Documents Electoral Bodies Election Committees and Candidates Turnout Results Statistical Data SENATE Created by
 top