.
.
Legal Acts
Documents
Electoral Bodies
Election Committees and Candidates
Turnout
Results
Statistical Data
SENATE
Created by
.
.
Voting Results
.
.
.
Voting Results for Committee
.
.
.
.
.
.
.
.
.
.
.
.
.
.
.
.
.
.
.
.
Polska
/
Kielce
/
włoszczowski, pow.
...
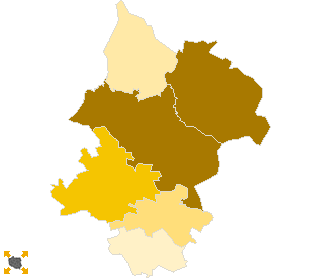
Komitet Wyborczy Platforma Obywatelska RP
List's Number:
8
No. of valid votes:
16686
No. of votes per List:
2597
15.56%
lack
4.69%
6.08%
7.47%
8.86%
10.25%
11.64%
13.03%
14.42%
15.81%
17.20%
not
of data
6.07%
7.46%
8.85%
10.24%
11.63%
13.02%
14.41%
15.80%
17.19%
18.59%
applicable
See also:
Turnout
Votes per Lists
Votes per Candidates
Information about Election Committee
Election results
Voting Results by location of ward electoral commission
.
.
Voting Results for Committee.
.
.
.
.
.
.
.
.
.
.
.
.
.
.
.
.
.
No.
Name
No. of entitled
to vote
No. of ballot papers
issued
No. of votes
No. of votes: per list / valid [%]
total
valid
per List
261301
Kluczewsko, gm.
4135
1842
1842
1768
132
7.47
261302
Krasocin, gm.
8417
3669
3667
3565
644
18.06
261303
Moskorzew, gm.
2435
1201
1201
1150
54
4.70
261304
Radków, gm.
2202
743
743
722
72
9.97
261305
Secemin, gm.
4176
1541
1541
1491
213
14.29
261306
Włoszczowa, gm.
16471
8244
8226
7990
1482
18.55
włoszczowski, pow.
37836
17240
17220
16686
2597
15.56
.
.
Voting Results for Candidates
.
.
.
.
.
.
.
.
.
.
.
.
.
.
.
No.
Surname Names
No. of votes
% No. of votes per candidate/No. per list
% No. of votes per candidate/No. of valid votes
1
MIODOWICZ Konstanty
832
32.03
4.99
2
GRZEGOREK Krzysztof Józef
204
7.85
1.22
3
PACELT Zbigniew
66
2.54
0.40
4
WRZAŁKA Zdzisław Feliks
46
1.77
0.28
5
GIERADA Artur Daniel
95
3.65
0.57
6
BODZIOCH Adam Andrzej
29
1.11
0.17
7
CICHOCKI Michał Ryszard
36
1.38
0.22
8
WALENDZIK Grzegorz Marcin
22
0.84
0.13
9
MARKOWSKA Henryka
31
1.19
0.19
10
OKŁA - DREWNOWICZ Marzena
63
2.42
0.38
11
MOSKAL Bogusław Adolf
14
0.53
0.08
12
ŚWIERCZ Grzegorz Maciej
42
1.61
0.25
13
MICH Eligiusz
10
0.38
0.06
14
ZWIERZCHOWSKI Wojciech Mieczysław
11
0.42
0.07
15
ZOCH Andrzej
25
0.96
0.15
16
NOWAK Mirosław
52
2.00
0.31
17
FATYGA Wiktor
341
13.13
2.04
18
HAMERA Lech Jan
43
1.65
0.26
19
FILOSEK Andrzej
2
0.07
0.01
20
KONIUSZ Krzysztof Jan
6
0.23
0.04
21
KUBA Jarosław
24
0.92
0.14
22
MAJCHER Wojciech Kazimierz
6
0.23
0.04
23
MARZEC Marcin
19
0.73
0.11
24
PIETRZCZYK Lucjan Marek
19
0.73
0.11
25
PYREK Jerzy Tadeusz
9
0.34
0.05
26
RACHTAN Piotr
3
0.11
0.02
27
RAMUS Roman Stanisław
13
0.50
0.08
28
STOLARSKI Jacek
427
16.44
2.56
29
PYTKO Włodzimierz Jan
3
0.11
0.02
30
WOLSKI Józef
17
0.65
0.10
31
ZIELONKA Jolanta Ewa
29
1.11
0.17
32
HABA Katarzyna
58
2.23
0.35
Σ
2597
100.00
15.56
.
.
Voting Results by location of ward electoral commission.
.
.
.
.
.
.
.
.
.
.
.
.
.
.
.
.
.
No.
Name
No. of entitled
to vote
No. of ballot
papers issued
No. of votes
No. of votes: per list / valid [%]
total
valid
per List
1
City
8882
4932
4929
4826
1125
23.31
2
Country
28954
12308
12291
11860
1472
12.41
.
Voting Results by number of inhabitants of commune
.
1
to 5 000
4637
1944
1944
1872
126
6.73
2
from 5 001 to 10 000
8311
3383
3383
3259
345
10.59
3
from 10 001 to 20 000
8417
3669
3667
3565
644
18.06
4
from 20 001 to 50 000
16471
8244
8226
7990
1482
18.55
5
from 50 001 to 100 000
0
0
0
0
0
0.00
6
from 100 001 to 200 000
0
0
0
0
0
0.00
7
from 200 001 to 500 000
0
0
0
0
0
0.00
8
over 500 000
0
0
0
0
0
0.00
Legal Acts
Documents
Electoral Bodies
Election Committees and Candidates
Turnout
Results
Statistical Data
SENATE
Created by
Copyright © 2007
Mikrobit Sp. z o.o.
. All Rights Reserved.
top