.
.
Legal Acts
Documents
Electoral Bodies
Election Committees and Candidates
Turnout
Results
Statistical Data
SENATE
Created by
.
.
Voting Results
.
.
.
Voting Results for Committee
.
.
.
.
.
.
.
.
.
.
.
.
.
.
.
.
.
.
.
.
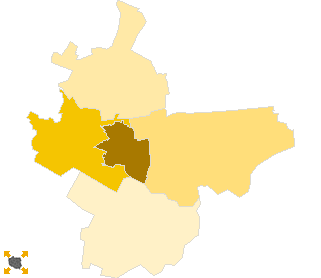
Polska
/
Kielce
/
starachowicki, pow.
...
Komitet Wyborczy Platforma Obywatelska RP
List's Number:
8
No. of valid votes:
35575
No. of votes per List:
10076
28.32%
lack
11.00%
13.38%
15.76%
18.14%
20.52%
22.90%
25.28%
27.66%
30.04%
32.42%
not
of data
13.37%
15.75%
18.13%
20.51%
22.89%
25.27%
27.65%
30.03%
32.41%
34.80%
applicable
See also:
Turnout
Votes per Lists
Votes per Candidates
Information about Election Committee
Election results
Voting Results by location of ward electoral commission
.
.
Voting Results for Committee.
.
.
.
.
.
.
.
.
.
.
.
.
.
.
.
.
.
No.
Name
No. of entitled
to vote
No. of ballot papers
issued
No. of votes
No. of votes: per list / valid [%]
total
valid
per List
261102
Brody, gm.
8736
3572
3561
3455
694
20.09
261103
Mirzec, gm.
6728
3085
3084
2996
463
15.45
261104
Pawłów, gm.
11667
4282
4282
4125
454
11.01
261101
Starachowice, m.
44646
22751
22739
22293
7740
34.72
261105
Wąchock, gm.
5858
2783
2782
2706
725
26.79
starachowicki, pow.
77635
36473
36448
35575
10076
28.32
.
.
Voting Results for Candidates
.
.
.
.
.
.
.
.
.
.
.
.
.
.
.
No.
Surname Names
No. of votes
% No. of votes per candidate/No. per list
% No. of votes per candidate/No. of valid votes
1
MIODOWICZ Konstanty
1772
17.58
4.98
2
GRZEGOREK Krzysztof Józef
1102
10.93
3.10
3
PACELT Zbigniew
543
5.38
1.53
4
WRZAŁKA Zdzisław Feliks
77
0.76
0.22
5
GIERADA Artur Daniel
535
5.30
1.50
6
BODZIOCH Adam Andrzej
44
0.43
0.12
7
CICHOCKI Michał Ryszard
114
1.13
0.32
8
WALENDZIK Grzegorz Marcin
3707
36.79
10.42
9
MARKOWSKA Henryka
128
1.27
0.36
10
OKŁA - DREWNOWICZ Marzena
619
6.14
1.74
11
MOSKAL Bogusław Adolf
45
0.44
0.13
12
ŚWIERCZ Grzegorz Maciej
89
0.88
0.25
13
MICH Eligiusz
45
0.44
0.13
14
ZWIERZCHOWSKI Wojciech Mieczysław
30
0.29
0.08
15
ZOCH Andrzej
22
0.21
0.06
16
NOWAK Mirosław
107
1.06
0.30
17
FATYGA Wiktor
43
0.42
0.12
18
HAMERA Lech Jan
55
0.54
0.15
19
FILOSEK Andrzej
14
0.13
0.04
20
KONIUSZ Krzysztof Jan
11
0.10
0.03
21
KUBA Jarosław
170
1.68
0.48
22
MAJCHER Wojciech Kazimierz
32
0.31
0.09
23
MARZEC Marcin
87
0.86
0.24
24
PIETRZCZYK Lucjan Marek
29
0.28
0.08
25
PYREK Jerzy Tadeusz
25
0.24
0.07
26
RACHTAN Piotr
186
1.84
0.52
27
RAMUS Roman Stanisław
8
0.07
0.02
28
STOLARSKI Jacek
34
0.33
0.10
29
PYTKO Włodzimierz Jan
12
0.11
0.03
30
WOLSKI Józef
44
0.43
0.12
31
ZIELONKA Jolanta Ewa
147
1.45
0.41
32
HABA Katarzyna
200
1.98
0.56
Σ
10076
100.00
28.32
.
.
Voting Results by location of ward electoral commission.
.
.
.
.
.
.
.
.
.
.
.
.
.
.
.
.
.
No.
Name
No. of entitled
to vote
No. of ballot
papers issued
No. of votes
No. of votes: per list / valid [%]
total
valid
per List
1
City
47010
23953
23941
23464
8067
34.38
2
Country
30625
12520
12507
12111
2009
16.59
.
Voting Results by number of inhabitants of commune
.
1
to 5 000
0
0
0
0
0
0.00
2
from 5 001 to 10 000
12586
5868
5866
5702
1188
20.83
3
from 10 001 to 20 000
20403
7854
7843
7580
1148
15.15
4
from 20 001 to 50 000
0
0
0
0
0
0.00
5
from 50 001 to 100 000
44646
22751
22739
22293
7740
34.72
6
from 100 001 to 200 000
0
0
0
0
0
0.00
7
from 200 001 to 500 000
0
0
0
0
0
0.00
8
over 500 000
0
0
0
0
0
0.00
Legal Acts
Documents
Electoral Bodies
Election Committees and Candidates
Turnout
Results
Statistical Data
SENATE
Created by
Copyright © 2007
Mikrobit Sp. z o.o.
. All Rights Reserved.
top