.
.
Legal Acts
Documents
Electoral Bodies
Election Committees and Candidates
Turnout
Results
Statistical Data
SENATE
Created by
.
.
Voting Results
.
.
.
Voting Results for Committee
.
.
.
.
.
.
.
.
.
.
.
.
.
.
.
.
.
.
.
.
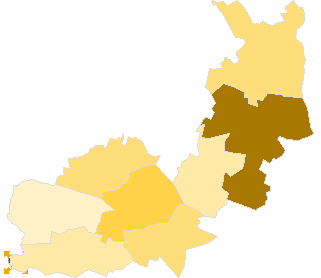
Polska
/
Kielce
/
opatowski, pow.
...
Komitet Wyborczy Platforma Obywatelska RP
List's Number:
8
No. of valid votes:
17810
No. of votes per List:
2350
13.19%
lack
5.61%
7.26%
8.91%
10.56%
12.21%
13.86%
15.51%
17.16%
18.81%
20.46%
not
of data
7.25%
8.90%
10.55%
12.20%
13.85%
15.50%
17.15%
18.80%
20.45%
22.11%
applicable
See also:
Turnout
Votes per Lists
Votes per Candidates
Information about Election Committee
Election results
Voting Results by location of ward electoral commission
.
.
Voting Results for Committee.
.
.
.
.
.
.
.
.
.
.
.
.
.
.
.
.
.
No.
Name
No. of entitled
to vote
No. of ballot papers
issued
No. of votes
No. of votes: per list / valid [%]
total
valid
per List
260601
Baćkowice, gm.
4172
1638
1638
1568
88
5.61
260602
Iwaniska, gm.
5594
2231
2230
2131
171
8.02
260603
Lipnik, gm.
4680
1771
1752
1681
192
11.42
260604
Opatów, gm.
10392
4672
4671
4468
658
14.73
260605
Ożarów, gm.
9295
3643
3638
3483
770
22.11
260606
Sadowie, gm.
3443
1277
1277
1237
145
11.72
260607
Tarłów, gm.
4649
1734
1734
1668
186
11.15
260608
Wojciechowice, gm.
3619
1644
1644
1574
140
8.89
opatowski, pow.
45844
18610
18584
17810
2350
13.19
.
.
Voting Results for Candidates
.
.
.
.
.
.
.
.
.
.
.
.
.
.
.
No.
Surname Names
No. of votes
% No. of votes per candidate/No. per list
% No. of votes per candidate/No. of valid votes
1
MIODOWICZ Konstanty
777
33.06
4.36
2
GRZEGOREK Krzysztof Józef
98
4.17
0.55
3
PACELT Zbigniew
206
8.76
1.16
4
WRZAŁKA Zdzisław Feliks
20
0.85
0.11
5
GIERADA Artur Daniel
104
4.42
0.58
6
BODZIOCH Adam Andrzej
17
0.72
0.10
7
CICHOCKI Michał Ryszard
36
1.53
0.20
8
WALENDZIK Grzegorz Marcin
38
1.61
0.21
9
MARKOWSKA Henryka
56
2.38
0.31
10
OKŁA - DREWNOWICZ Marzena
81
3.44
0.45
11
MOSKAL Bogusław Adolf
12
0.51
0.07
12
ŚWIERCZ Grzegorz Maciej
28
1.19
0.16
13
MICH Eligiusz
15
0.63
0.08
14
ZWIERZCHOWSKI Wojciech Mieczysław
6
0.25
0.03
15
ZOCH Andrzej
8
0.34
0.04
16
NOWAK Mirosław
35
1.48
0.20
17
FATYGA Wiktor
22
0.93
0.12
18
HAMERA Lech Jan
11
0.46
0.06
19
FILOSEK Andrzej
3
0.12
0.02
20
KONIUSZ Krzysztof Jan
4
0.17
0.02
21
KUBA Jarosław
169
7.19
0.95
22
MAJCHER Wojciech Kazimierz
350
14.89
1.97
23
MARZEC Marcin
36
1.53
0.20
24
PIETRZCZYK Lucjan Marek
9
0.38
0.05
25
PYREK Jerzy Tadeusz
3
0.12
0.02
26
RACHTAN Piotr
6
0.25
0.03
27
RAMUS Roman Stanisław
21
0.89
0.12
28
STOLARSKI Jacek
8
0.34
0.04
29
PYTKO Włodzimierz Jan
7
0.29
0.04
30
WOLSKI Józef
82
3.48
0.46
31
ZIELONKA Jolanta Ewa
31
1.31
0.17
32
HABA Katarzyna
51
2.17
0.29
Σ
2350
100.00
13.19
.
.
Voting Results by location of ward electoral commission.
.
.
.
.
.
.
.
.
.
.
.
.
.
.
.
.
.
No.
Name
No. of entitled
to vote
No. of ballot
papers issued
No. of votes
No. of votes: per list / valid [%]
total
valid
per List
1
City
11499
5057
5055
4856
1131
23.29
2
Country
34345
13553
13529
12954
1219
9.41
.
Voting Results by number of inhabitants of commune
.
1
to 5 000
7062
2921
2921
2811
285
10.14
2
from 5 001 to 10 000
19095
7374
7354
7048
637
9.04
3
from 10 001 to 20 000
19687
8315
8309
7951
1428
17.96
4
from 20 001 to 50 000
0
0
0
0
0
0.00
5
from 50 001 to 100 000
0
0
0
0
0
0.00
6
from 100 001 to 200 000
0
0
0
0
0
0.00
7
from 200 001 to 500 000
0
0
0
0
0
0.00
8
over 500 000
0
0
0
0
0
0.00
Legal Acts
Documents
Electoral Bodies
Election Committees and Candidates
Turnout
Results
Statistical Data
SENATE
Created by
Copyright © 2007
Mikrobit Sp. z o.o.
. All Rights Reserved.
top