.
.
Legal Acts
Documents
Electoral Bodies
Election Committees and Candidates
Turnout
Results
Statistical Data
SENATE
Created by
.
.
Voting Results
.
.
.
Voting Results for Committee
.
.
.
.
.
.
.
.
.
.
.
.
.
.
.
.
.
.
.
.
Polska
/
Gdańsk
/
sztumski, pow.
...
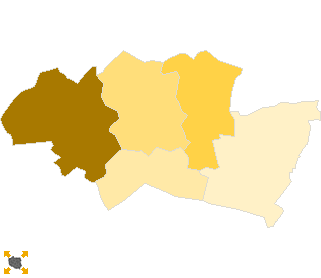
Komitet Wyborczy Platforma Obywatelska RP
List's Number:
8
No. of valid votes:
13974
No. of votes per List:
6372
45.60%
lack
32.20%
34.08%
35.96%
37.84%
39.72%
41.60%
43.48%
45.36%
47.24%
49.12%
not
of data
34.07%
35.95%
37.83%
39.71%
41.59%
43.47%
45.35%
47.23%
49.11%
51.00%
applicable
See also:
Turnout
Votes per Lists
Votes per Candidates
Information about Election Committee
Election results
Voting Results by location of ward electoral commission
.
.
Voting Results for Committee.
.
.
.
.
.
.
.
.
.
.
.
.
.
.
.
.
.
No.
Name
No. of entitled
to vote
No. of ballot papers
issued
No. of votes
No. of votes: per list / valid [%]
total
valid
per List
221601
Dzierzgoń, gm.
7445
3028
3027
2934
1263
43.05
221602
Mikołajki Pomorskie, gm.
2828
864
864
804
276
34.33
221603
Stary Dzierzgoń, gm.
3256
970
970
919
296
32.21
221604
Stary Targ, gm.
4998
1766
1766
1706
660
38.69
221605
Sztum, gm.
15673
7800
7800
7611
3877
50.94
sztumski, pow.
34200
14428
14427
13974
6372
45.60
.
.
Voting Results for Candidates
.
.
.
.
.
.
.
.
.
.
.
.
.
.
.
No.
Surname Names
No. of votes
% No. of votes per candidate/No. per list
% No. of votes per candidate/No. of valid votes
1
NOWAK Sławomir Ryszard
1299
20.38
9.30
2
ZIELIŃSKA-GŁĘBOCKA Anna Maria
339
5.32
2.43
3
RYBICKI Arkadiusz Czesław
150
2.35
1.07
4
KOZDROŃ Jerzy
993
15.58
7.11
5
OŁOWSKI Piotr Paweł
94
1.47
0.67
6
NEUMANN Sławomir Arkadiusz
75
1.17
0.54
7
CZAPLA Mirosław Jan
274
4.30
1.96
8
POMASKA Agnieszka Dominika
137
2.15
0.98
9
ORŁOWSKI Paweł
76
1.19
0.54
10
BOROWCZAK Jerzy Stanisław
92
1.44
0.66
11
ŚWILSKI Ryszard Jan
23
0.36
0.16
12
TARASZKIEWICZ-GURZYŃSKA Maria Barbara
50
0.78
0.36
13
PAWŁOWSKI Bogdan Józef
161
2.52
1.15
14
KULAS Jan Edward
172
2.69
1.23
15
GAŁKA Wiesław Jerzy
35
0.54
0.25
16
KALICKI Stanisław Aleksander
31
0.48
0.22
17
PRUŚ Sylwester Zbigniew
27
0.42
0.19
18
SZABANOWICZ Helena Halina
30
0.47
0.21
19
WORON Aleksandra Urszula
33
0.51
0.24
20
KASZUBSKI Adam
891
13.98
6.38
21
CZERNIEWSKI Paweł Marcin
23
0.36
0.16
22
ZIELIŃSKI Jan
43
0.67
0.31
23
GUZOWSKA Iwona Kamila
318
4.99
2.28
24
WAŁĘSA Jarosław Leszek
1006
15.78
7.20
Σ
6372
100.00
45.59
.
.
Voting Results by location of ward electoral commission.
.
.
.
.
.
.
.
.
.
.
.
.
.
.
.
.
.
No.
Name
No. of entitled
to vote
No. of ballot
papers issued
No. of votes
No. of votes: per list / valid [%]
total
valid
per List
1
City
15567
8035
8034
7856
4086
52.01
2
Country
18633
6393
6393
6118
2286
37.37
.
Voting Results by number of inhabitants of commune
.
1
to 5 000
6084
1834
1834
1723
572
33.20
2
from 5 001 to 10 000
12443
4794
4793
4640
1923
41.44
3
from 10 001 to 20 000
15673
7800
7800
7611
3877
50.94
4
from 20 001 to 50 000
0
0
0
0
0
0.00
5
from 50 001 to 100 000
0
0
0
0
0
0.00
6
from 100 001 to 200 000
0
0
0
0
0
0.00
7
from 200 001 to 500 000
0
0
0
0
0
0.00
8
over 500 000
0
0
0
0
0
0.00
Legal Acts
Documents
Electoral Bodies
Election Committees and Candidates
Turnout
Results
Statistical Data
SENATE
Created by
Copyright © 2007
Mikrobit Sp. z o.o.
. All Rights Reserved.
top