.
.
Legal Acts
Documents
Electoral Bodies
Election Committees and Candidates
Turnout
Results
Statistical Data
SENATE
Created by
.
.
Voting Results
.
.
.
Voting Results for Committee
.
.
.
.
.
.
.
.
.
.
.
.
.
.
.
.
.
.
.
.
Polska
/
Gdańsk
/
tczewski, pow.
...
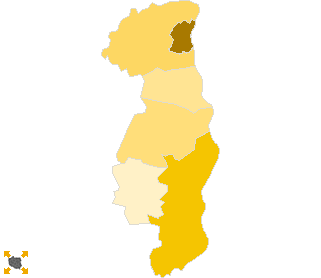
Komitet Wyborczy Platforma Obywatelska RP
List's Number:
8
No. of valid votes:
42820
No. of votes per List:
20686
48.31%
lack
30.26%
32.58%
34.90%
37.22%
39.54%
41.86%
44.18%
46.50%
48.82%
51.14%
not
of data
32.57%
34.89%
37.21%
39.53%
41.85%
44.17%
46.49%
48.81%
51.13%
53.46%
applicable
See also:
Turnout
Votes per Lists
Votes per Candidates
Information about Election Committee
Election results
Voting Results by location of ward electoral commission
.
.
Voting Results for Committee.
.
.
.
.
.
.
.
.
.
.
.
.
.
.
.
.
.
No.
Name
No. of entitled
to vote
No. of ballot papers
issued
No. of votes
No. of votes: per list / valid [%]
total
valid
per List
221402
Gniew, gm.
12416
5140
5136
4958
2216
44.70
221403
Morzeszczyn, gm.
2817
1122
1122
1054
319
30.27
221404
Pelplin, gm.
12640
5305
5304
5110
1971
38.57
221405
Subkowy, gm.
3847
1666
1665
1608
588
36.57
221406
Tczew, gm.
8563
3972
3970
3835
1571
40.96
221401
Tczew, m.
47128
26664
26659
26255
14021
53.40
tczewski, pow.
87411
43869
43856
42820
20686
48.31
.
.
Voting Results for Candidates
.
.
.
.
.
.
.
.
.
.
.
.
.
.
.
No.
Surname Names
No. of votes
% No. of votes per candidate/No. per list
% No. of votes per candidate/No. of valid votes
1
NOWAK Sławomir Ryszard
3431
16.58
8.01
2
ZIELIŃSKA-GŁĘBOCKA Anna Maria
906
4.37
2.12
3
RYBICKI Arkadiusz Czesław
503
2.43
1.17
4
KOZDROŃ Jerzy
134
0.64
0.31
5
OŁOWSKI Piotr Paweł
427
2.06
1.00
6
NEUMANN Sławomir Arkadiusz
527
2.54
1.23
7
CZAPLA Mirosław Jan
140
0.67
0.33
8
POMASKA Agnieszka Dominika
348
1.68
0.81
9
ORŁOWSKI Paweł
272
1.31
0.64
10
BOROWCZAK Jerzy Stanisław
292
1.41
0.68
11
ŚWILSKI Ryszard Jan
123
0.59
0.29
12
TARASZKIEWICZ-GURZYŃSKA Maria Barbara
1587
7.67
3.71
13
PAWŁOWSKI Bogdan Józef
115
0.55
0.27
14
KULAS Jan Edward
7764
37.53
18.13
15
GAŁKA Wiesław Jerzy
100
0.48
0.23
16
KALICKI Stanisław Aleksander
51
0.24
0.12
17
PRUŚ Sylwester Zbigniew
54
0.26
0.13
18
SZABANOWICZ Helena Halina
70
0.33
0.16
19
WORON Aleksandra Urszula
64
0.30
0.15
20
KASZUBSKI Adam
96
0.46
0.22
21
CZERNIEWSKI Paweł Marcin
45
0.21
0.11
22
ZIELIŃSKI Jan
116
0.56
0.27
23
GUZOWSKA Iwona Kamila
648
3.13
1.51
24
WAŁĘSA Jarosław Leszek
2873
13.88
6.71
Σ
20686
100.00
48.30
.
.
Voting Results by location of ward electoral commission.
.
.
.
.
.
.
.
.
.
.
.
.
.
.
.
.
.
No.
Name
No. of entitled
to vote
No. of ballot
papers issued
No. of votes
No. of votes: per list / valid [%]
total
valid
per List
1
City
60570
32696
32687
32062
16585
51.73
2
Country
26841
11173
11169
10758
4101
38.12
.
Voting Results by number of inhabitants of commune
.
1
to 5 000
2817
1122
1122
1054
319
30.27
2
from 5 001 to 10 000
3847
1666
1665
1608
588
36.57
3
from 10 001 to 20 000
33619
14417
14410
13903
5758
41.42
4
from 20 001 to 50 000
0
0
0
0
0
0.00
5
from 50 001 to 100 000
47128
26664
26659
26255
14021
53.40
6
from 100 001 to 200 000
0
0
0
0
0
0.00
7
from 200 001 to 500 000
0
0
0
0
0
0.00
8
over 500 000
0
0
0
0
0
0.00
Legal Acts
Documents
Electoral Bodies
Election Committees and Candidates
Turnout
Results
Statistical Data
SENATE
Created by
Copyright © 2007
Mikrobit Sp. z o.o.
. All Rights Reserved.
top